
")
The price action on the Bitcoin chart is creating more uncertainty with each passing day. Fear has flooded the market, which is also resulting in the weakening of many altcoin positions. Is there really anything to fear?
Much depends on your point of view
It turns out that perspectives vary, depending on what we take as the determinant of the current situation. In this article we want to take a look at some basic on-chain data. Before doing so, however, let’s turn our attention to global economic conditions.
This is where inflation comes into the picture, and it is proceeding at a dizzying pace, often significantly ahead of economists’ predictions. Of course, most of the talk is about the United States where statistics remain mind boggling. Data for December shows that the purchasing value of money there fell by 7% year-over-year. This is the highest recorded result in 40 years. Perhaps the inflation is temporary, at least that’s how politicians portray it. However, their earlier assurances have not been confirmed by official data, which creates social uncertainty. The result is the need to hedge wealth and buy scarce assets so that losses due to inflation are not felt. This is a bullish signal for Bitcoin.
At the same time, governments are fighting the encounter in the best possible ways. The main one is raising interest rates. As of now, we have yet to see the positive effects of these actions. What we do know is that tightening monetary policy in turn has a negative effect on Bitcoin’s appreciation, as this pulls capital out of scarce goods. Thus, we are seeing short-term contradictory signals.
Price chart, and on-chain data
Looking at the chart, we see that the price of BTC is right on the long-term support line. It dates back to the summer of 2020, when Bitcoin broke a three-year period of decline. This point is a critical one, but it is also very strong.

At the same time, on another chart we see ATH. This is of course the Hash Rate, which has survived the move of miners from China as well as the recent difficult political situation in Kazakhstan.

One key chart that like the Bitcoin price, is finding its critical support point is Dormancy Flow. It is shared with us by well-known on-chain analyst Will Clemente, who points out the area that Bitcoin has reached. This is the noted potential bottom in the valuation of the king of cryptocurrencies for the sixth time in history, and at the same time the region from which a significant bounce has occurred more than once. Unambiguously, this is a particularly bullish signal.

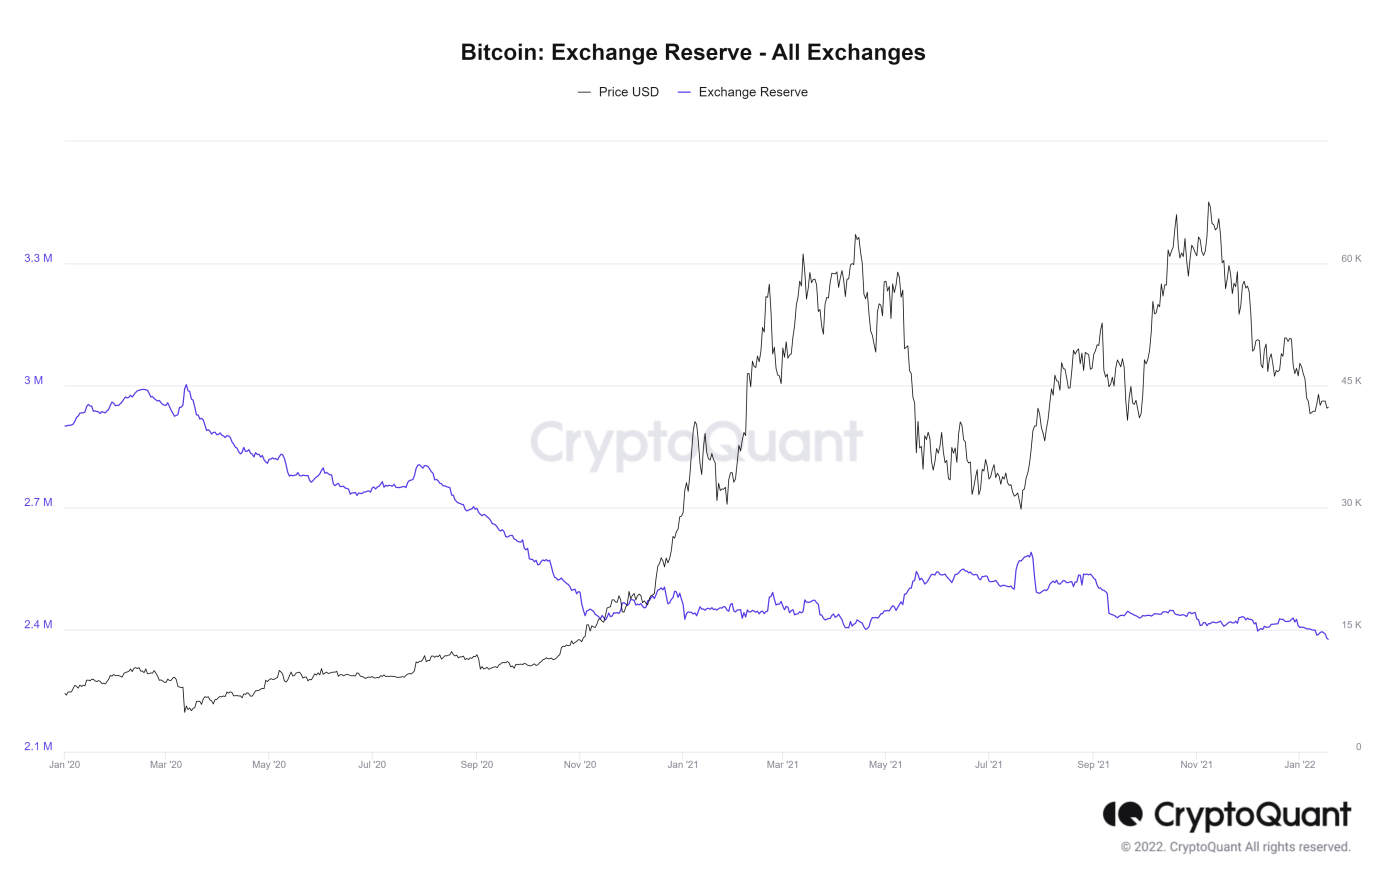
By contrast, BTC reserves on exchanges have been steadily declining. Since we don’t see any inflow of new coins, it means that not many investors are willing to liquidate their funds at the current prices.
It happens that one of the reasons for the fall is the so-called overleveraging. This means that traders are overly optimistic about the situation on the chart and open a large number of leveraged growth positions. Although currently there are more and more leveraged positions on the market, they are more and more evenly distributed. This is shown on the Funding Rates chart. Looking at the data it provides us with we can see that the sentiment is starting to even out.
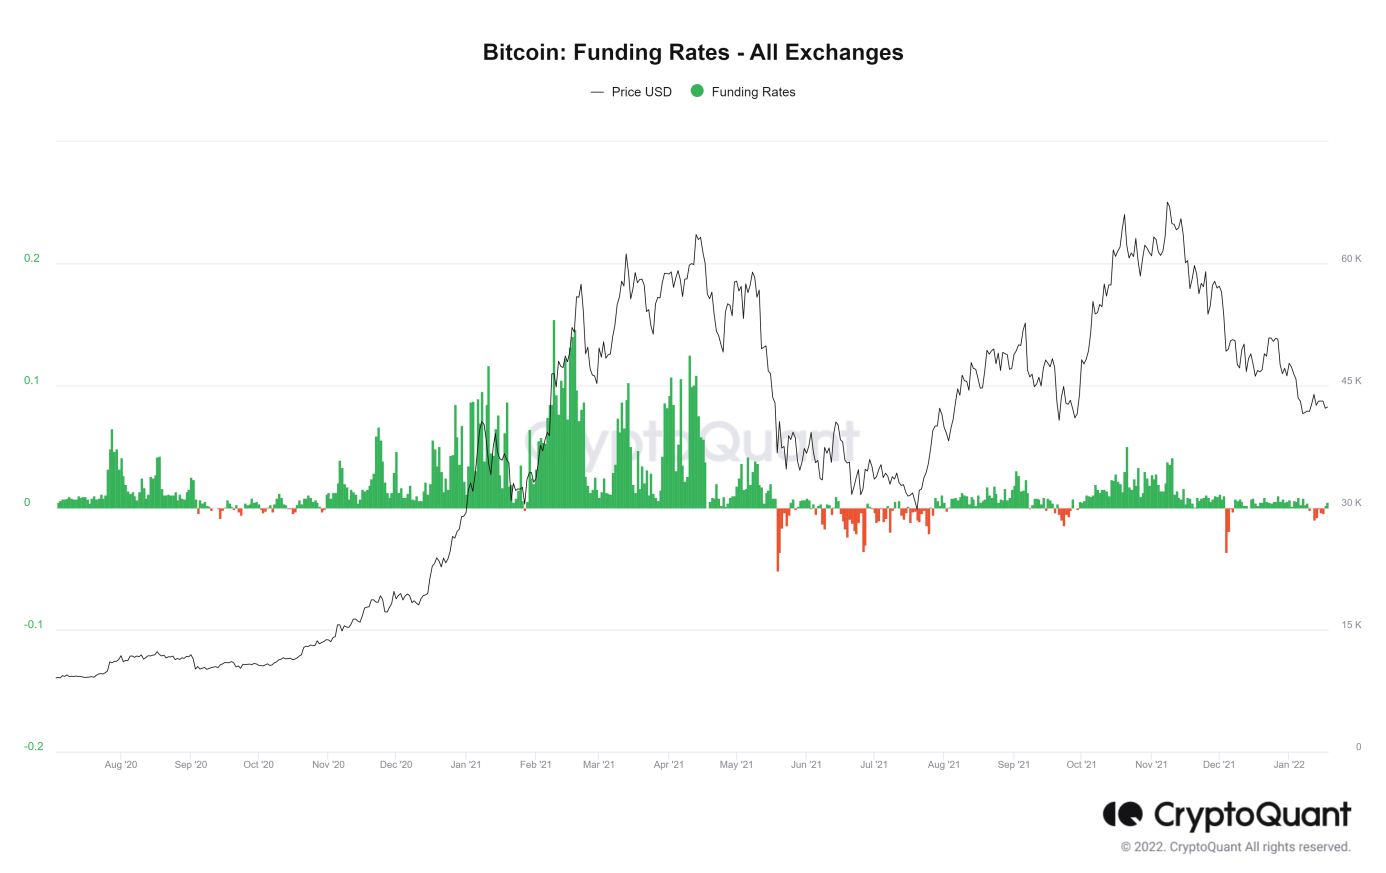
This last metric indicates that both bulls and bears are not leading. This may suggest a potential period of sideways movement. However, when we take a further look at the data cited in this material, we can surmise that the current situation is a bit more optimistic than price presents.


