

When analyzing the situation on the cryptocurrency market, and especially when we talk about Bitcoin data, we should take into account many aspects. One of the most popular studies we can perform is, of course, fundamental analysis, which will give us a macro-level picture with long-term characteristics, so to speak. This kind of approach is very often supported by technical analysis. In its case, the time frame can be defined freely. Together, these are elements used in the traditional stock market and translated into the cryptocurrency market. However, the world of digital assets, thanks to its transparency, also provides us with so-called onchain data. This is information directly from the blockchain, showing such aspects as for example the number and size of cryptographic wallets, traffic on addresses or even inflows and outflows of cryptocurrencies from exchanges. An excellent monitoring tool is Glassnode, which allows us to see a range of data from this sector. We will take a look at Onchain Metrics in this article, taking a look at the latest information coming to us.
Traffic on the exchanges
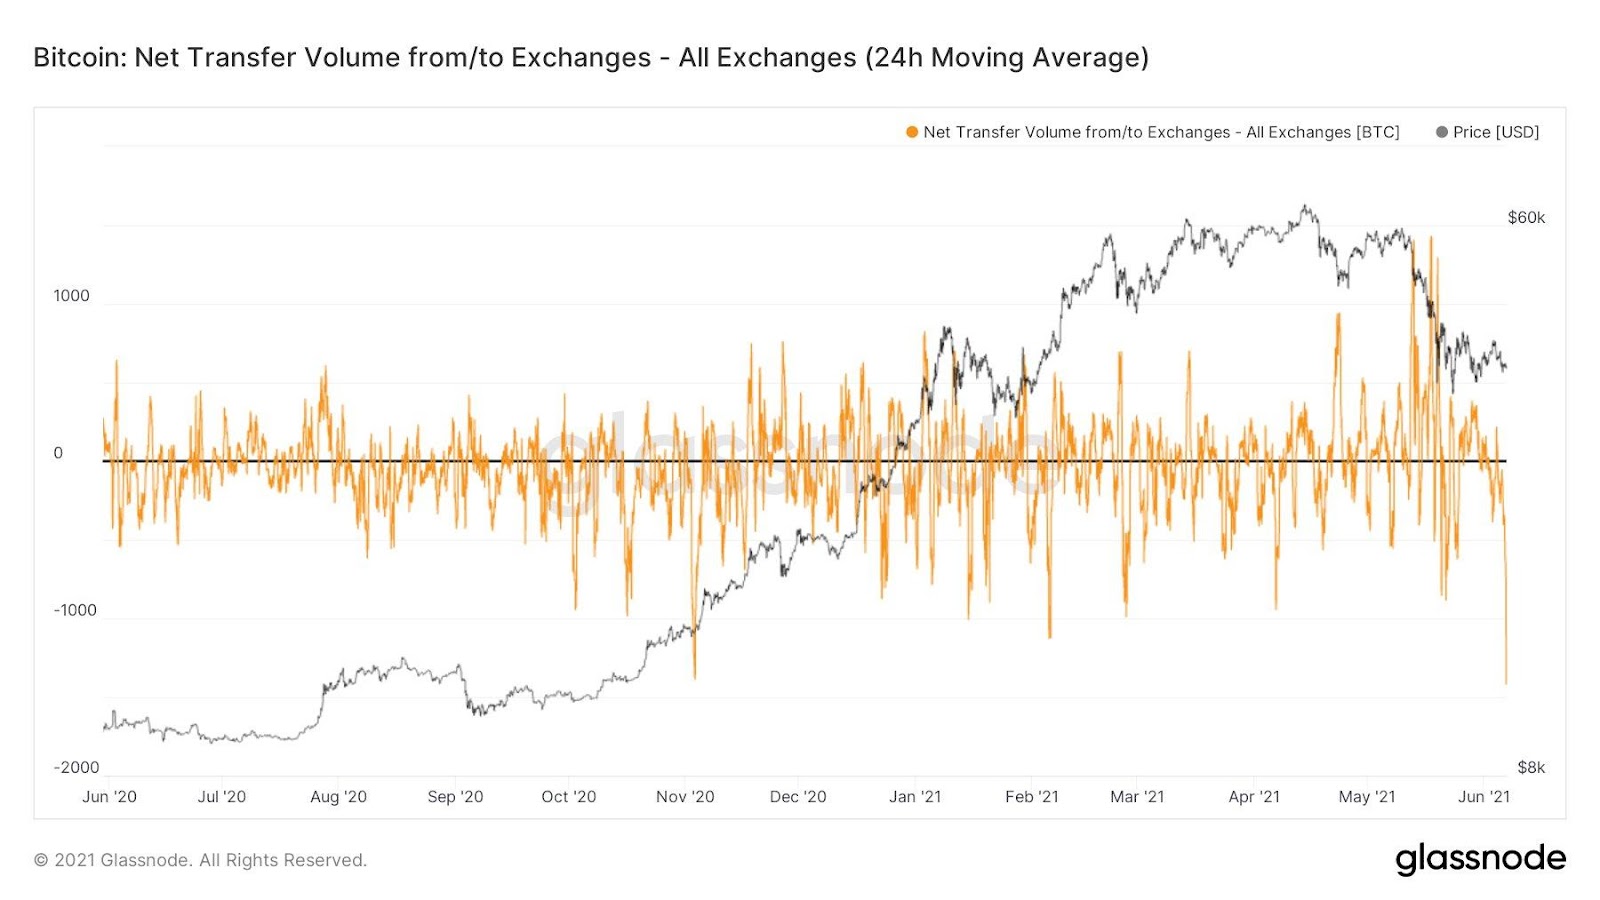
One of the most relevant metrics is information on the flow of BTC to and from exchanges. You can see here that when the big Bitcoin sell-off in May began, inflows to the exchanges hit record highs over the past year. However, the beginning of June completely reversed this trend. While we are seeing Bitcoin oscillating between $30,000 and $40,000, outflows from exchanges are increasing significantly, reaching levels last seen in November 2020. This means that for many investors, the current price of BTC therefore seems to be a bargain, with withdrawals to external wallets suggesting an expected increase in the price of the asset in the long term.
Wallets with a value of 1 BTC and more
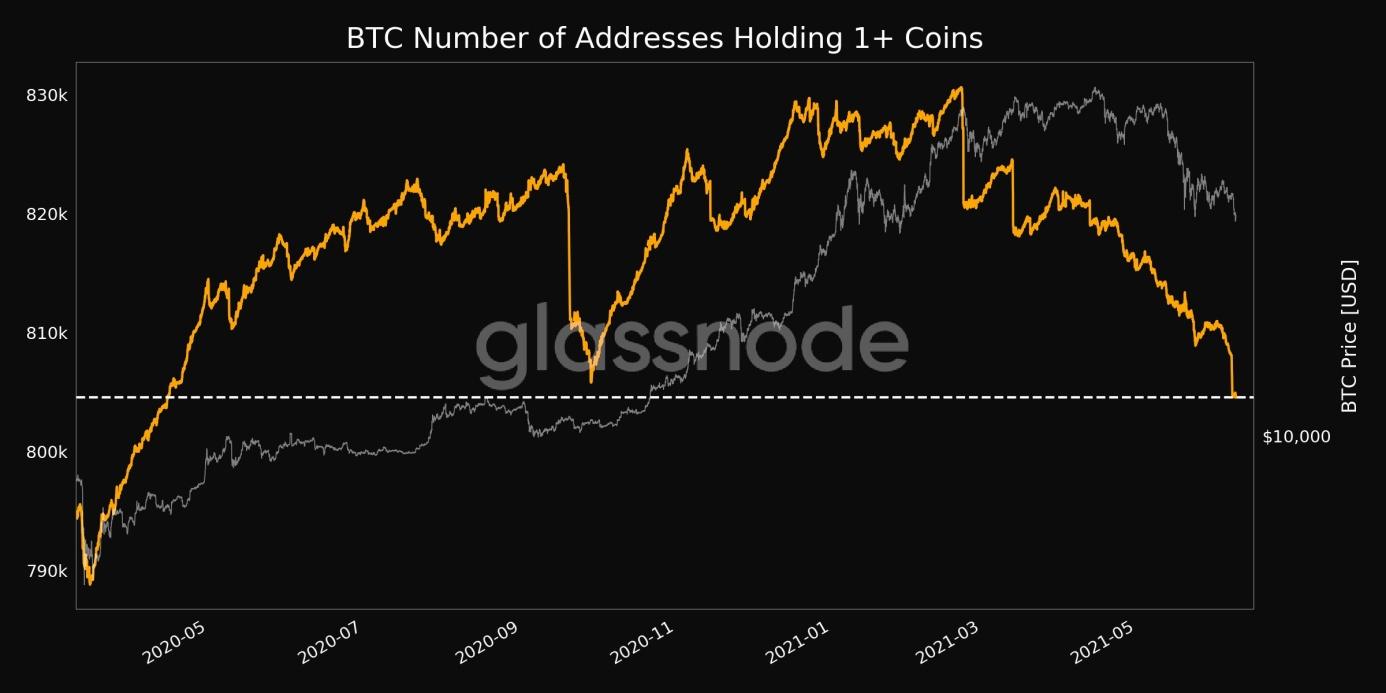
An interesting indicator is the number of addresses holding 1 BTC and more. Here we can observe a significant decrease in their number. While Bitcoin was reaching its April ATH, we noted these wallets around 830 thousand. Today they are around 805 thousand. In a very similar area, the king of cryptocurrencies was at the beginning of October 2020, when its price oscillated between $10,500 and $13,500. This was the period just before a significant upward price movement.
Number of addresses in proficiency
One of the key factors determining further price movements is the number of BTC addresses in the proficiency.
In recent times we have seen many investors, especially short term investors, realize their losses during sharp declines by selling Bitcoin at a lower price than the purchase price. Onchain analysis allows us to observe not only the value of assets sold at a loss, but also the amount of BTC that still has unrealized profit. We can observe that the addresses that purchased BTC at a price lower than the current price are more than 28 million. However, this is a significant decrease from the level of less than 37 million that we recorded back in April.

Active network addresses
A fantastic tool based on onchain data is shared by lookintobitcoin.com.
The active addresses sentiment indicator compares the 28-day change in price (orange line) against the 28-day change in the number of active addresses (gray line). Both expressed as percentages, it tells us the short-term sentiment indicator. The red and green dashed lines show the standard deviations. When the orange line crosses the red line it indicates an overheated market indicating that the price is rising too fast in relation to the number of active addresses. This indicates the likelihood of a correction. On the other hand, when the orange price line crosses the lower range marked by the green line, then the market sentiment is too negative, which often results in a more positive sentiment. Currently, we are just in this area.


