After Bitcoin reached $33,000 and still remains under the medium-term downtrend line, most altcoins are waiting for a breakout. Not among them, however, is Ether, which is showing significant movement on the chart against BTC.
Ether to Bitcoin gains
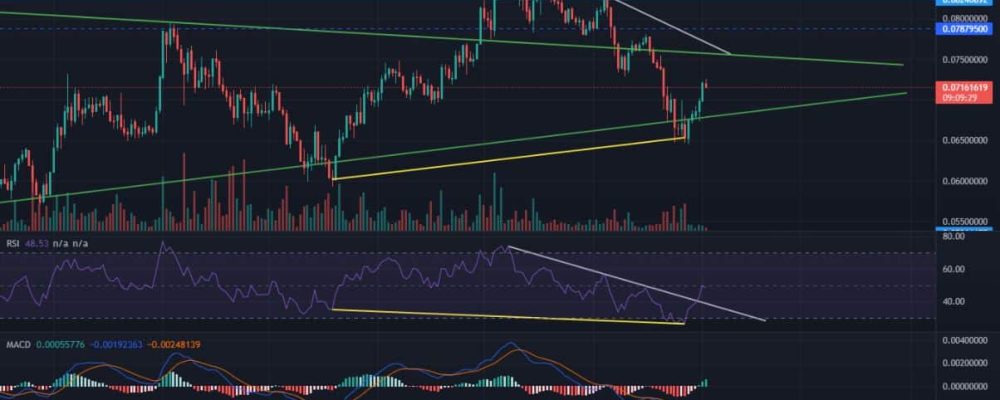
The second largest coin, despite its deep decline, is behaving exceptionally well. This is particularly reflected in the chart relative to Bitcoin. In addition to the observed increase of 12% from the bottom of the decline, there are still several important indicators in play that suggest a continuation of the trend.
First of all, Ether managed to return to the symmetrical triangle in which it was previously located. This move was accompanied by a break of the downward trend line of RSI, which at the same time shows a bullish divergence that has been forming since mid-October. A similar one is observed on MACD. The continuation of the trend may result in a rise to levels above 0.088 BTC. A possible rebound, which is entitled to occur after contact with the downtrend on the chart, may result in declines to the vicinity of 0.060 BTC.
Solana is also doing well
Solana also scored a solid rebound. After falling to close to $81.00, it recorded an increase of up to 40%. The level from which it started its upward movement is slightly below the local peak from August 2020, which is a very important technical signal. Currently, SOL is in a descending channel as well as below the downtrend line on the RSI. A factor indicating bullish momentum is the MACD, which clearly suggests upside. For the moment, however, expect Solana to move inside the formed pattern.
Is Terra LUNA playing out a dramatic scenario?
Not all coins that record a rebound look bullish. One example is Terra, which seems to be playing out a head and shoulders pattern. The potential downside range is as low as $20.00, where resistance was located in March 2021 and where we saw support in September.
A symptom in favor of the upside is the bullish RSI divergence. However, once LUNA records any daily close below $38.00, this divergence will be invalidated. This is a very important level to watch, in terms of further moves of the coin.
Meanwhile, Bitcoin itself…
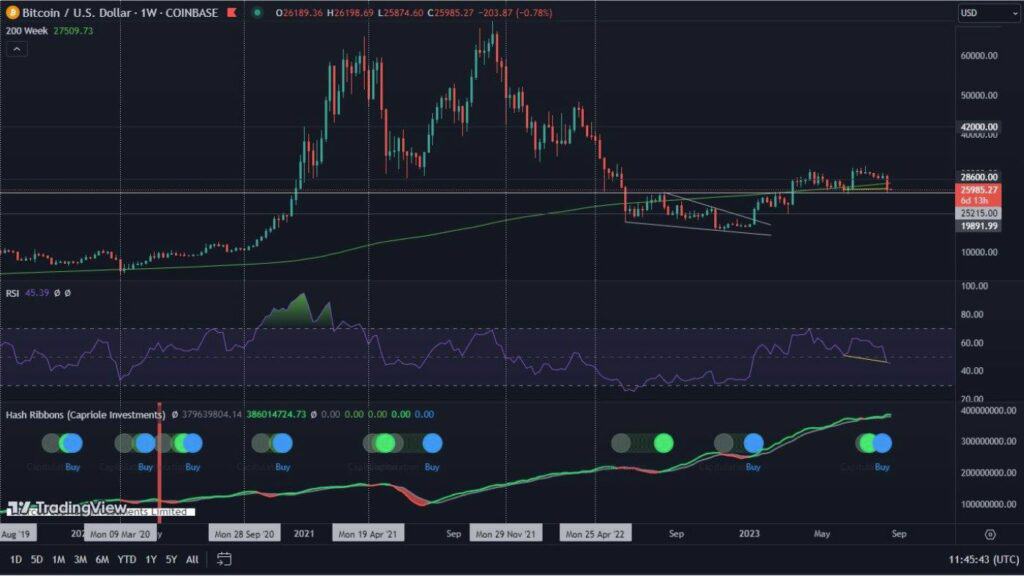
The leading cryptocurrency has clearly broken through the downtrend line on the RSI. Currently, it is struggling with resistance due to the presence of the downtrend line on the price chart. A breakout may suggest an attempt to break through resistance in the $40,000-42,000 zone. We should also pay attention to the level of $33,000 (yellow line), which may again be confirmed as support. This may take place even after breaking through the downtrend line!
Bitcoin Dominance
A lot of answers as to the next moves, can be contained in the Bitcoin dominance chart. Here we see the ongoing struggle inside the descending triangle since April 2021. Although the MACD suggests a decline in BTC’s dominance, it is important to note that Bitcoin has been gaining strength over altcoins recently, mostly when it is losing value. One more touch on the upper edge of the triangle while Bitcoin falls to $33,000 still remains highly probable, making this a scenario we should keep in mind.


