

Bitcoin has fallen into stagnation, which on the chart is beginning to take the shape of a very bullish formation. Unfortunately, at the same time, the MACD, on the weekly interval, indicated an event that hasn’t happened since last April, and which theoretically doesn’t mean anything good. Let’s take a look at its historical implications.
Bitcoin on the weekly chart
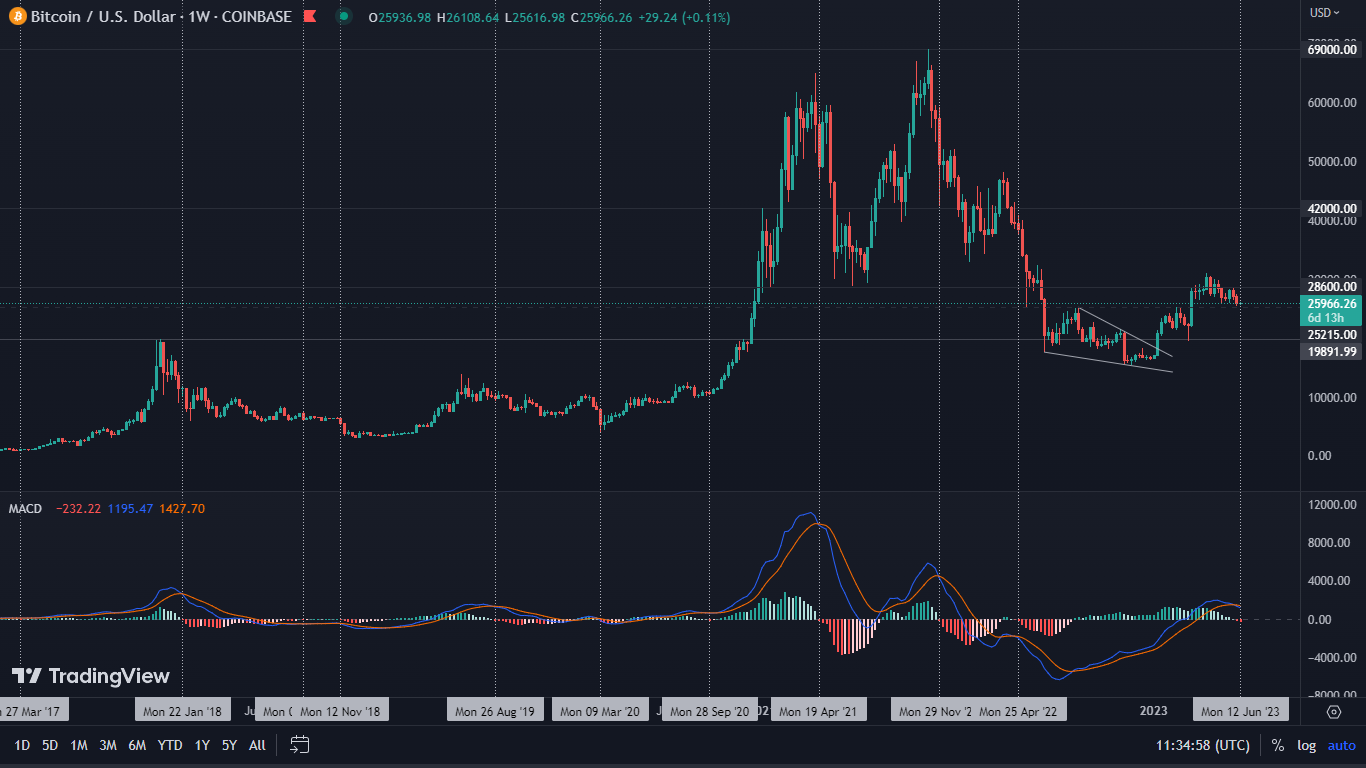
Traditionally, we begin our analysis by presenting the condition of Bitcoin on a weekly chart. We can clearly see that the market has temporarily lost interest in the leading cryptocurrency, causing it to decline in value by 4.4%. The RSI continues to present a bearish divergence, which is constantly likely to widen. A very worrying sign is the fact that the BTC price closed the past 7-day period, 2% below the 200-week moving average. As we know, this SMA is repeatedly cited as the boundary between bullish and bearish territory. At the moment, the latter seem to be coming to the fore.
Fortunately, another boundary of a similar nature is the RSI value, which for the time being remains above the 51 level, i.e. in bullish territory.
The most troublesome chart indicator, however, is becoming the MACD, which has made a clear bearish cross.

MACD bearish cross and its consequences
April 2022 was the last time a bearish MACD cross appeared on the weekly interval of the Bitcoin chart. After one of the longest periods of waiting, it is making its presence known again. To talk about its potential consequences, it is worth looking at its historical impact on the price of BTC. Below is a summary of the last ten such events and their effects.
March 2017: indicating a bottom and +2000% in 37 weeks,
January 2018: -26% in 1 week,
September 2018: only sideways movement,
November 2018: -42% in 4 weeks,
August 2019: -33% in 16 weeks,
March 2020: bottom indication and +140% in 22 weeks,
September 2020: bottom indication and +520% in 27 weeks,
April 2021: -41% in 4 weeks,
November 2021: -32% in 8 weeks,
April 2022: -55% in 8 weeks.
To summarize, the facts are as follows:
In six out of ten cases, the bearish MACD cross suggested a continuation of declines. Barely once the event did not affect further price movement. In the remaining three situations, the MACD behavior marked a price bottom and led to a strong rebound of the cryptocurrency.
The above examples show that the consequences of a bearish MACD cross are ambiguous. However, it is worth noting that in the current downward cycle, this is the third cross that Bitcoin has experienced. Instead, looking for precise parallels to specific instances in the history of BTC, it is difficult not to talk about the events of 2019. Thus, if the theory regarding the “echo bubble” is confirmed, a price action similar to that time may prove to be as justified as possible.
Bitcoin on the daily chart
Finally, we present the highlights of Bitcoin’s daily chart. It is worth noting that the leading cryptocurrency is in the process of building a bullish formation. One can argue about its characteristics. Looking at the price ranges, we see that it is a descending channel. If, on the other hand, we focus on the opening and closing ranges of the candles themselves, the formation is a descending wedge. What is worrisome, however, is that the 100-day SMA, which has historically provided excellent resistance as well as support, has been lost. Looking through the structure of the formation, as well as the next support derived from the position of the 200-day SMA, it becomes possible for the price to descend to the area indicated by the circle.


