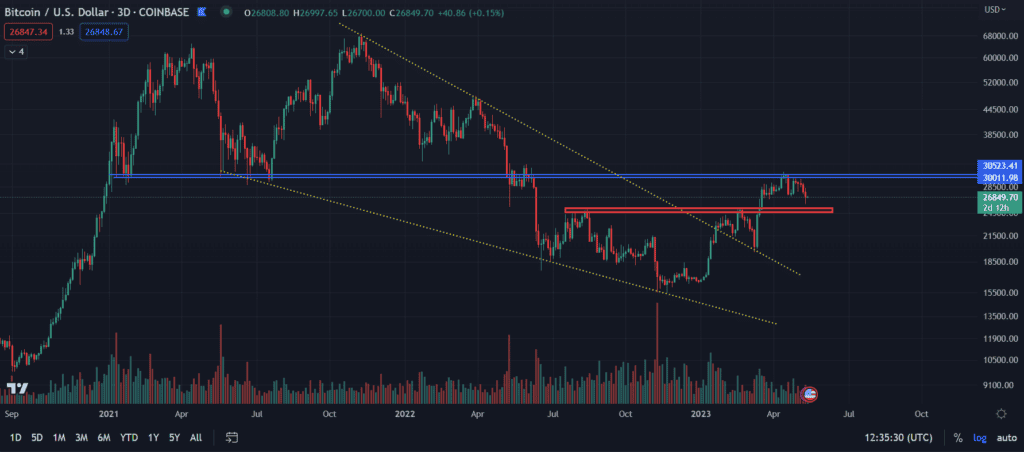
The weekend is approaching, which often represents a time when Bitcoin’s volatility regularly weakens. So it is a good opportunity to look at the analyses of individual market veterans. Here are four fresh perspectives on the current BTC price situation.
Material Indicators presents the orderbook
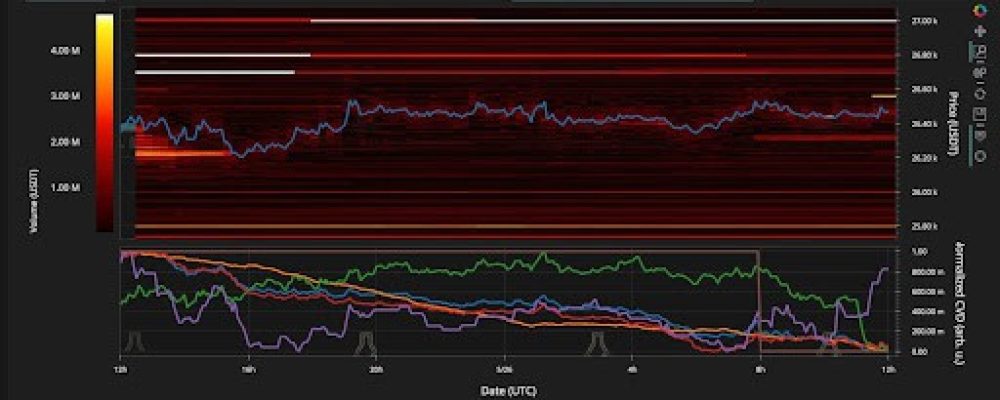
Classically, the first to present is the data shared by @MI_Algos. This popular analyst specializes in presenting Bitcoin’s orderbook. In his tweet on Friday, he presented the current state of affairs.
Here's how the #BTC order book is set up ahead of the Economic Reports. If support at $27k doesn't hold, $26.5k can come into focus very quickly. Holding the 200-Week Moving Average is critical for bulls. pic.twitter.com/B65oRDlLX3
— Material Indicators (@MI_Algos) June 2, 2023
As he notes:
“If support at $27,000 does not hold, $26,500 could come very soon. Holding the 200-week moving average is crucial for bulls.”
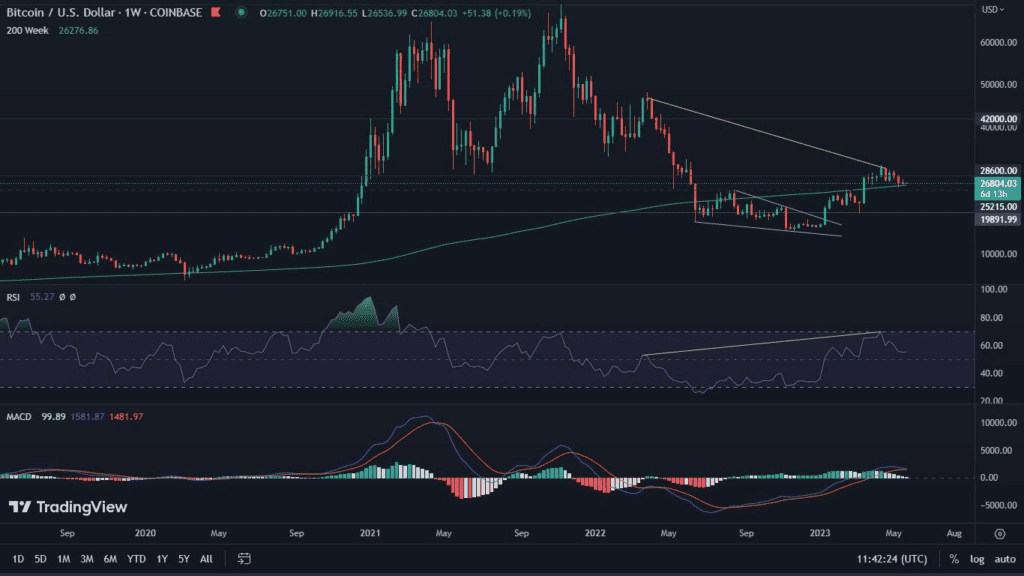
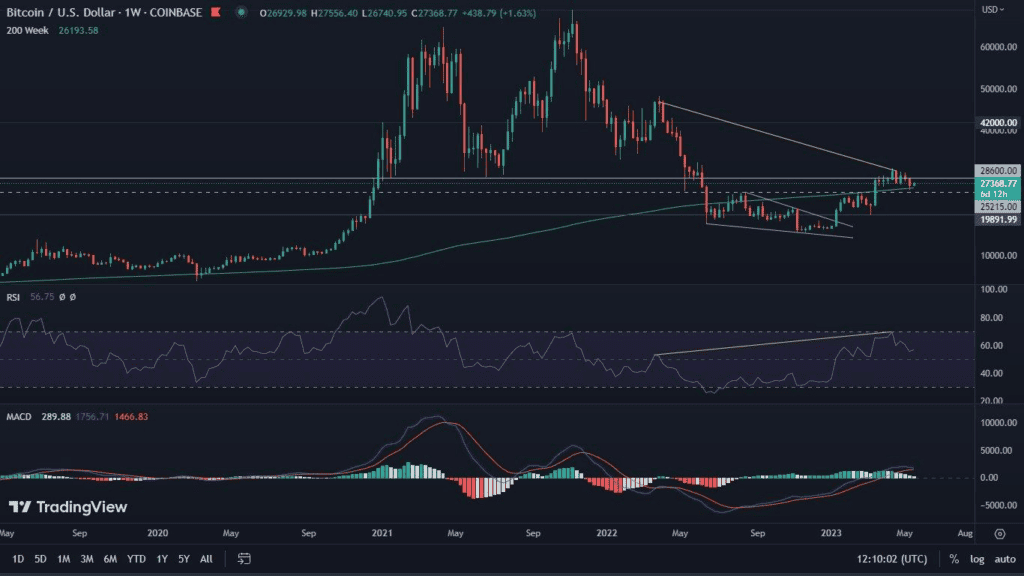
The data provided by @MI_Algos coincides perfectly with the analysis we did a few days ago. In it, we also highlight the 200-week moving average, suggesting that it is an important support level for sustaining further bullish price action for Bitcoin.
You can learn more about it in the material below:
“A battle between bears and bulls is growing on the Bitcoin chart. The coming days may determine the cryptocurrency’s next move.”
Seth remains bullish
Also prominent is the voice of @seth_fin, who points out the bullish structure of the BTC chart.
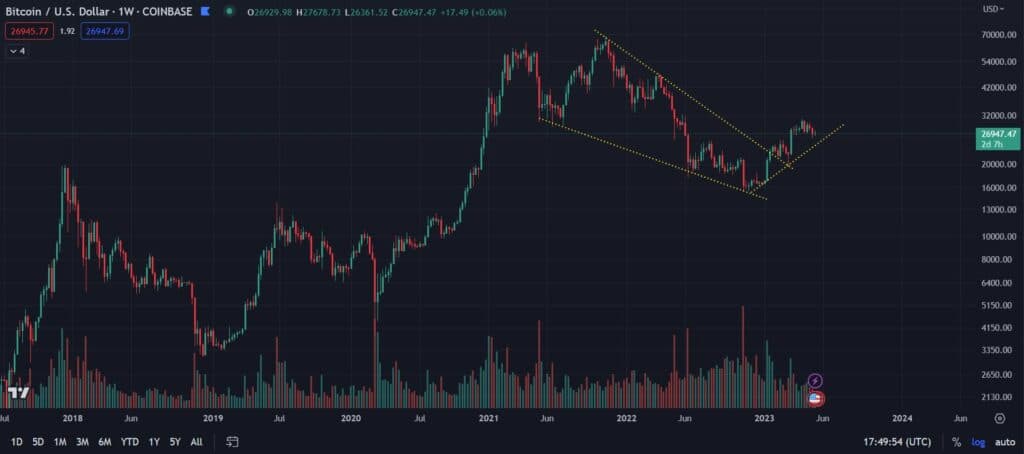
#Bitcoin just made double Bottom, then we made a Higher Low 🔥🚀📈 Get ready for some big Waves 🌊📈#Crypto #BTC #HODL #cryptocurrency pic.twitter.com/9uKBj18kzT
— Seth (@seth_fin) June 2, 2023
As it reads:
“Bitcoin just reached a double bottom and then reached a higher low. Get ready for big waves.”
Seth, therefore, is not assuming a scenario in which Bitcoin’s price is expected to retreat in the near future. Instead, he looks out for clear increases.
Tara also sees opportunities for dynamic increases
@PrecisionTrade3 focuses on price waves and reports on his observations.
Yes, I'm well aware #BTC is not $58k and that it's June 2. That prediction was posted in January of this year and should have read, "The highest BTC COULD reach is $58k"… Either way, I'm tracking the waves as they form. #Bitcoin just completed Wave 4 and is making it's way to… pic.twitter.com/HbzxcH7Uft
— TARA (@PrecisionTrade3) June 2, 2023
“I’m tracking the emerging waves. Bitcoin has just completed wave four and is approaching wave five, which should be the peak of the year. I still believe it will happen in June! The sub-waves have already started and I will keep you posted on their formation!”
As the analyst points out in her tweet, she expected higher price ceilings to break out earlier. Nevertheless, nothing is yet lost, making her believe that overcoming resistance in the zone between $30,000 and $32,000 should take place in the coming weeks.
CrypNuevo controls the four-hour chart
@CrypNuevo also looks at Bitcoin’s situation with a favorable eye. He notes some resistance, which, however, in his opinion (looking through the posted graphic), may not pose a major problem.
Quick $BTC update:
— CrypNuevo 🔨 (@CrypNuevo) June 2, 2023
Short liquidations are stacking up and we have an interesting liquidity zone between $28.1k and $28.3k that also matches with the 50% of the wick. So that zone is an important target at the moment imo.
The 50 EMA in 4h time frame is the main resistance at the… pic.twitter.com/0toRAvKIgM
“The short liquidation is accumulating and we have an interesting liquidity zone between $28,100 and $28,300, which also corresponds to the 50% taper. So this zone is an important target at the moment.
The 50 EMA in the 4h time frame is now the main resistance.”
So as we can see, the vast majority of the market is in favor of bullish price action. As a rule, when such situations occur, Bitcoin makes a completely opposite move. Will this be the case this time as well? We will soon find out.

