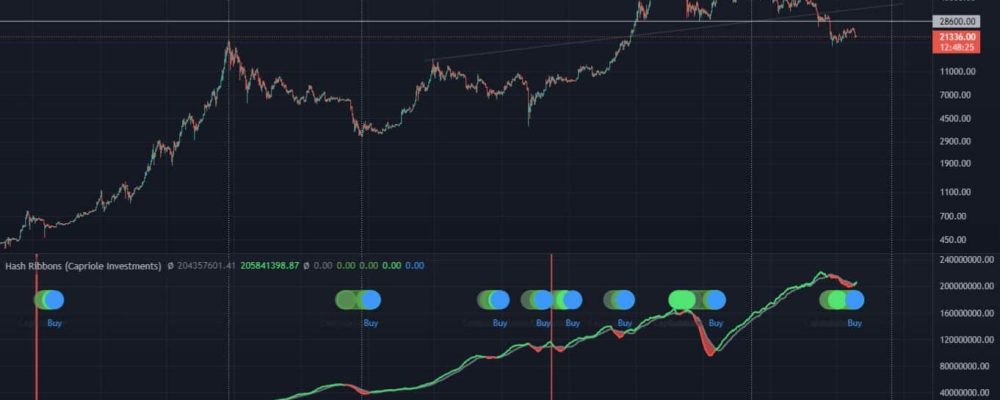
It has been seen twelve times, and each time increases followed. We are talking about the Hash Ribbons indicator and the buying signal appearing on it. Will it be similar this time? Does the signal give reason to believe that the bottom of BTC’s valuation has already been reached?
The strength of Hash Ribbons
In early June, we drew attention to the Hash Ribbons indicator. At that time, a bearish cross appeared on it, heralding the beginning of the capitulation of the miners. This event very often resulted in Bitcoin’s subsequent reaching a valuation bottom. The moment when miners begin to make profits again from mining, in turn, results in a bullish cross and the subsequent appearance of a buying signal. This one took place this past weekend.
The Hash Ribbons buying signal has appeared on Bitcoin’s chart 12 times so far. And each time it heralded an upcoming medium-term and sometimes even long-term rally.
So let’s take a look at the values of these breakouts:
December 2011: +76% in 15 days,
June 2012: +156% in 58 days,
February 2013: +1195% in 61 days,
January 2015: +13% in 43 days,
May 2015: +40% in 66 days,
August 2016: +96% in 127 days (and about +4500% in 469 days),
January 2019: +250% in 167 days,
December 2019: +46% in 47 days,
April 2020: +41% in 38 days,
July 2020: +35% in 36 days,
December 2020: +250% in 133 days,
August 2021: +61% in 95 days.
The above data confirms the strength of Hash Ribbons, while also illustrating the situation that occurred during periods of the bull market. They show that the average rally at the time was much more modest than the potential opportunities and amounted to about 45%.
Bitcoin technically
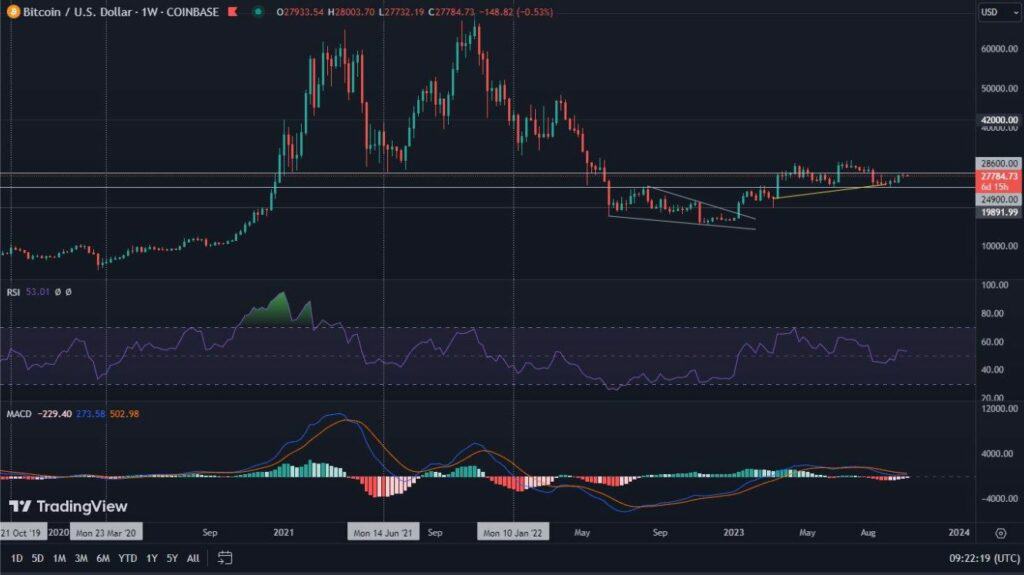
After the recent rejection of important resistance by the US SPX index, Bitcoin reacted in a similar manner and oscillated in value. At the time of writing this analysis, it is oscillating around $21,500. In doing so, it finds support at the uptrend line forming from the level of this year’s low. Volumes remain low, and the MACD has slowed down the downward movement and is starting to head upward. It is worth noting that the RSI indicates a bullish divergence. However, it is very weak, and does not enter the oversold area, which could result in its rapid negation. When looking for price targets, it is worth following the structure of the chart. The maximum is defined by the long-term downtrend line, which is currently located near $26,450. In turn, possible declines, suggest the possibility of reaching $17,600, where the June lows are located.
Will Hash Ribbons show more strength from the current chart structure?
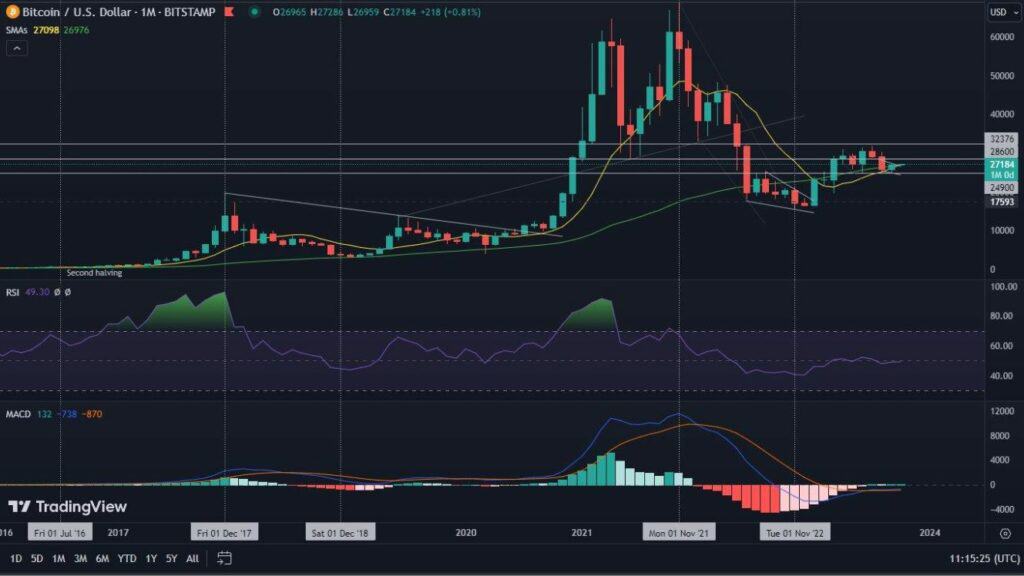
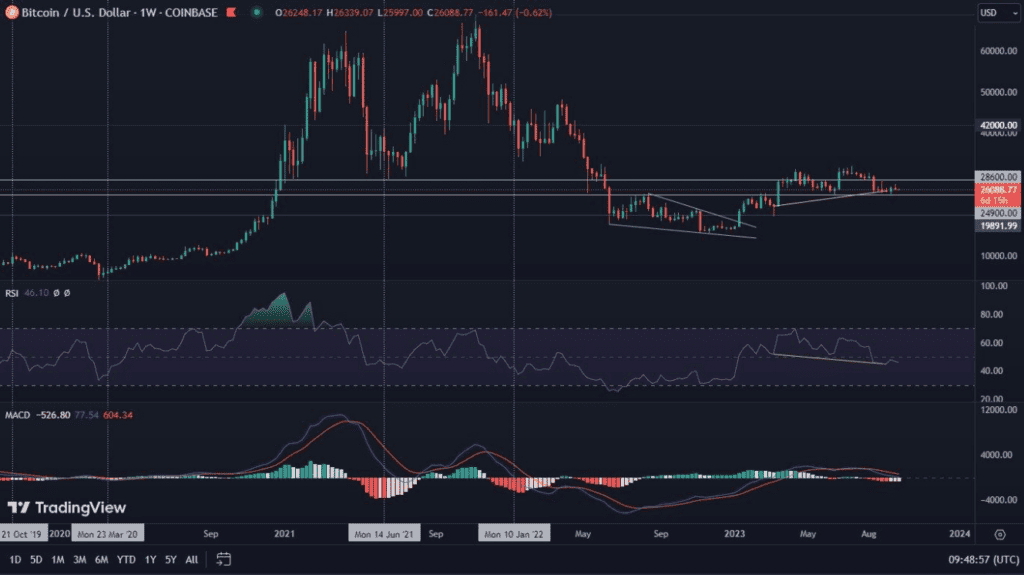
Looking at the chart from a long-term perspective, we see, on the other hand, a very clear downtrend and few factors that would support breaking it. Undoubtedly, the bullish MACD cross, as well as the Hash Ribbons Buying Signal (not yet confirmed on the below attached chart with a weekly interval), argue for increases. However, the past week alone, ended for Bitcoin with a decline of 11.5% and a simultaneous, renewed descent below the 200-week SMA. This may mean that macroeconomic factors, which are currently the foundations for the price action, are much stronger than any indicators present on the charts.

