In recent months, the macroeconomic environment of the globe has not been positive for Bitcoin’s price action. Meanwhile rumors have emerged that have sent BTC all the way to the downtrend line with a potential breach. Something like this has not happened in a long time. Could it be that the long-awaited turning point is coming?
Bitcoin on the weekly chart
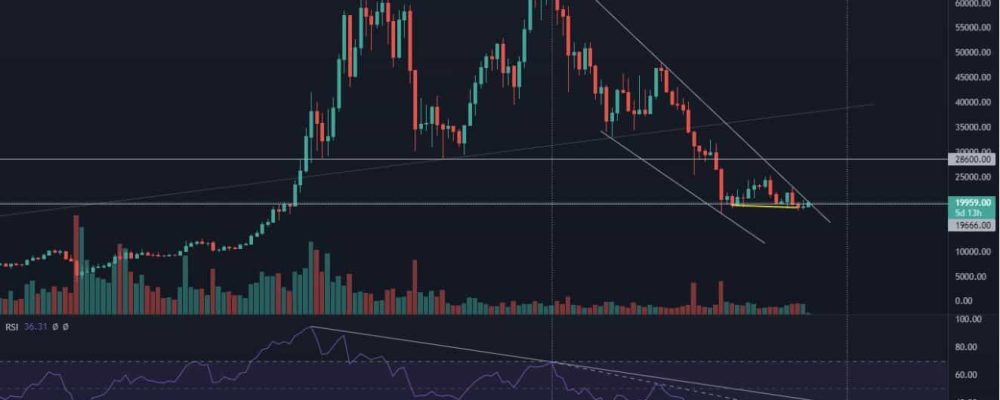
We begin of course with the weekly perspective. A lot of interesting things are happening here. What should be noted first and foremost is that despite the green candle, Bitcoin closed the trading week below the 2017 peak for the third consecutive week. In total, counting since June, this is the fifth such situation. Meanwhile, the RSI is sending two positive signals. One is the defense of the first of two downward trend lines (dashed line) and the bullish divergence that still persists (yellow line).
Thus, the information sent by the indicator may suggest a short-term period of growth. However such a long price action below such a significant level should be very worrying.
Bitcoin on the daily chart
The daily chart on the other hand, brings us surprising data. It turns out that Bitcoin has managed to reach the long-term downward trend line. Moreover, going down to the lower time intervals we can see that it has been violated. This is a particularly unique occurrence, since during previous price rallies BTC was not able to approach this area. This may indicate growing market optimism.
At the moment the most important indicator on the chart becomes volume. It is its value that will provide the answer as to whether a possible breakthrough of the line has the potential to take the price higher. Nevertheless its low level may indicate a false breakout. Modest volume values may also accompany the possible continuation of the sideways trend, which also has the right to result in a breakthrough of the line. This situation therefore, will not affect the change in the main trend.
Credit Suisse drives the market
It sounds somewhat perverse, but the factor driving the current price action is not only the bullish divergence of the RSI, but also the dramatic situation of one of the largest banks in the world. Credit Suisse is of systemic importance to the globe and its eventual collapse has the right to result in a gigantic economic crisis.
Its plight is reflected not only in equities, but also, on the CDS chart. A CDS, or credit default swap, is a derivative instrument that provides collateral in the event of a debt default. In recent days, Credit Suisse has seen a significant increase in demand for this type of asset. The chart below compares us today with data from up to 20 years ago. We can clearly see that investors have clear reasons for concern. But if this is the case, why are the markets rising?
Well, the current situation is observed by representatives of central banks. As a result, there have been rumors about a possible suspension of interest rate hikes. This is to try to stabilize the bank’s situation. Withholding rate hikes is a bullish signal to the market. This one, however, apparently takes it with too much excitement. Let’s remember that holding off on rate hikes is not the same as cutting them. Moreover, interest rates are structured to act with a lag. This means that the current optimism may only be short-term. Thus, the possible continuation of increases, still does not put off the specter of deeper declines.


