This year’s Bitcoin rally continues. The first quarter brings investors an excellent rate of return. Will the following months sustain the good streak? For the time being, BTC is facing its last resistance on the way to regaining the $30,000 level. Let’s check how the key indicators look at this time.
Bitcoin on the weekly chart
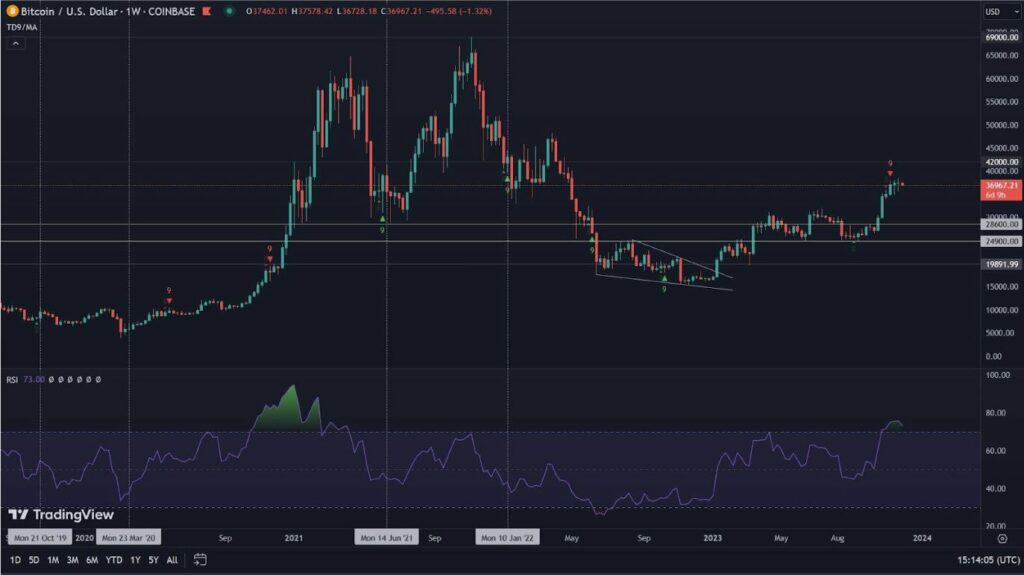
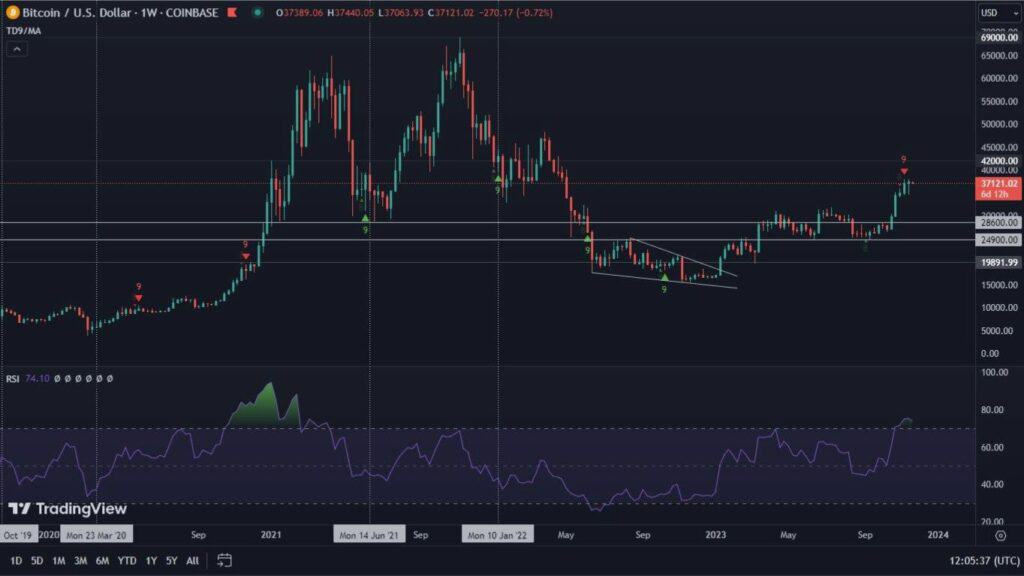
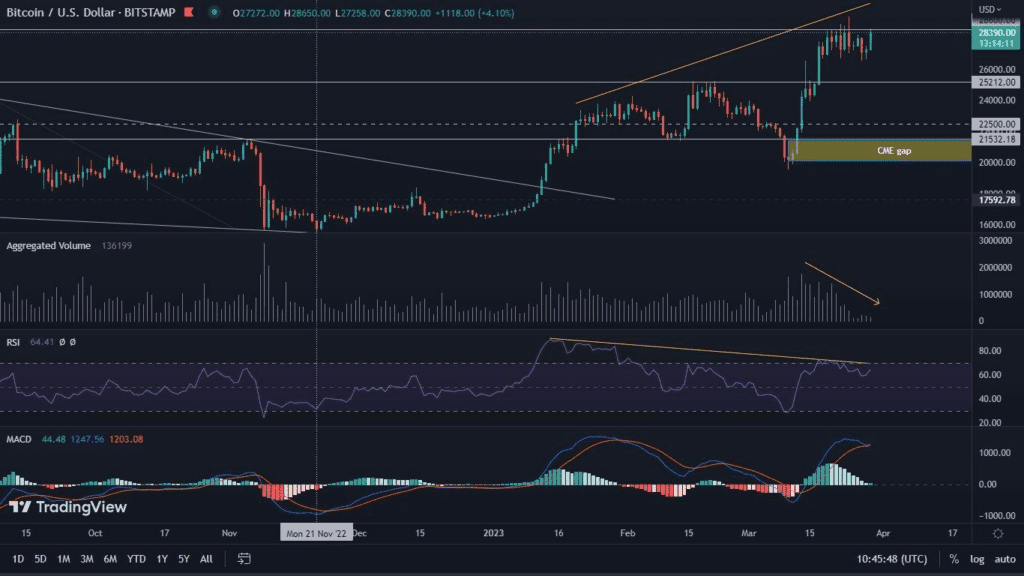
Traditionally, we start our analysis by looking at the broad perspective of the weekly chart. The first and obvious thing that strikes our eyes is the 0.25% drop in the value of BTC. Not much, but the construction of the candle clearly indicates the market uncertainty, which appears in addition around the key resistance, set just below the value of $29,000.
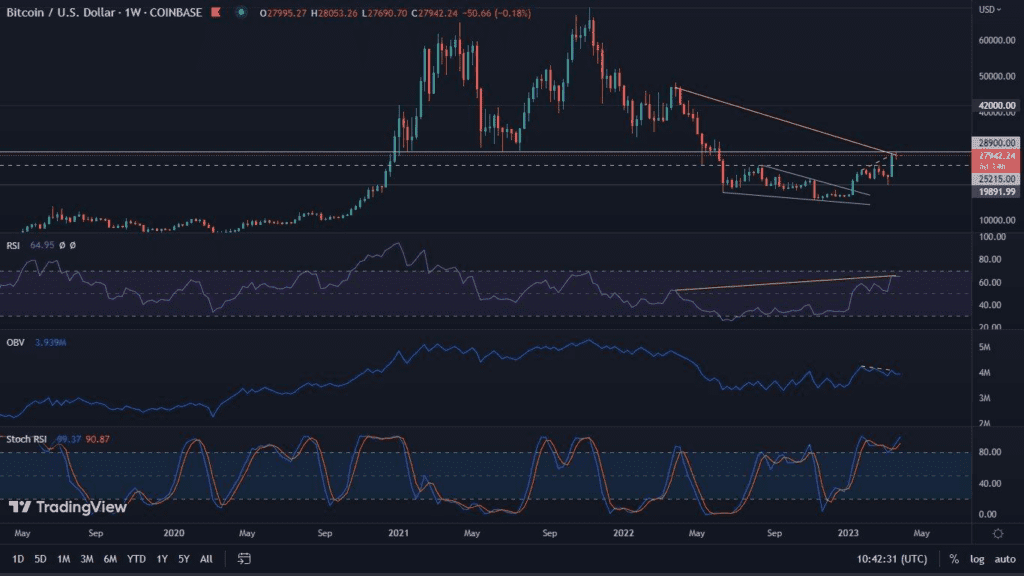
At the same time, the chart hosts the long-indicated bearish RSI divergence, which nevertheless may still be stretching. A similar divergence, but on a shorter timeframe, is presented by the OBV indicator. Meanwhile, the nominal RSI is still held at a very decent level, currently at 65, which strongly favors the bulls.
An additional warning signal, however, is sent by the Stochastic RSI, which is once again pushing towards its extremes.
Bitcoin on the daily chart
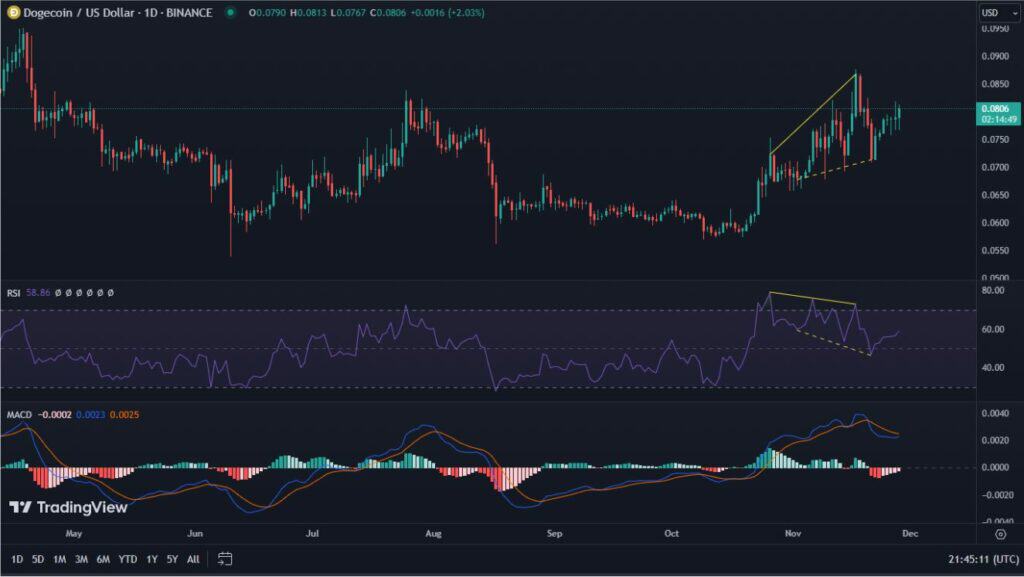
The resistance we are talking about in the case of the weekly chart is even more clearly delineated on the daily interval. We have determined it in the vicinity of $28,600. At the same time, we see that the price has attempted to break through it more than once, each time doing so unsuccessfully. At the time of writing this analysis, we are observing another such attempt.
What strikes the eye most is the waning volume. The increase in price, with low values on the indicator scale, tells us that the price movement is simply weak. Of course, we will have to wait until the close of the trading session to fully assess the volume. Nevertheless, it already provides a clear warning signal. At the same time, it is difficult not to notice the very wide bearish divergence of the RSI, which is located in the overbought area, which gives it great strength. The MACD, on the other hand, is behaving in an interesting way. Yesterday, on our Twitter profile (if you’re not already watching, be sure to start), we pointed out that this indicator was heading for a bearish cross. Today, in turn, we see an attempt to avoid it. Will it prove successful? It is possible, provided that the price rise finally gains more strength on volume.
The daily interval does not stop sending bearish signals
However, this is not all. Another series of warning signals is sent by the ADX index, which helps us measure the strength of the trend. On it we see a clear rounded peak, indicating a potential reversal. In addition, compared to the previous rise, it too is forming a bearish divergence. OBV is behaving similarly.
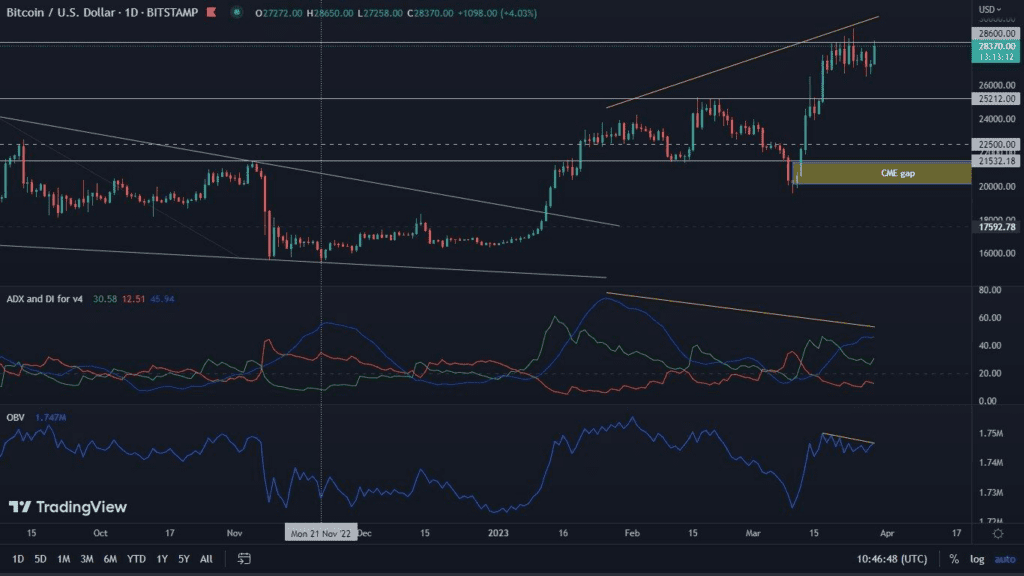
In summary, Bitcoin’s chart does not currently look bullish. There are many indications that it may take the leading cryptocurrency a little longer to overcome the $30,000 level. A potential deeper correction, before the next attack, would be advisable here and would certainly reset most indicators. Expecting one, the $25,200 level is worth watching. A possible attack on higher levels, unconfirmed by an increase in volume, could instead result in the drawing of a long wick and a subsequent even deeper price retreat.