After five consecutive week closes in the area below the 200-week moving average, bitcoin appears to be at the threshold of a new rally. Altcoins are also posting dynamic gains. They are led by Ethereum.
Bitcoin (BTC) on the weekly chart
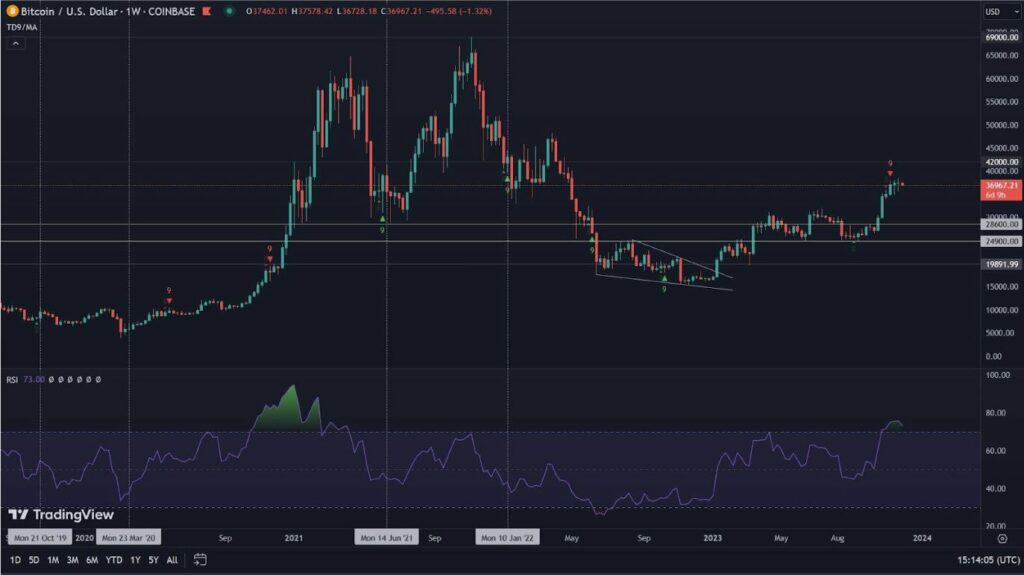
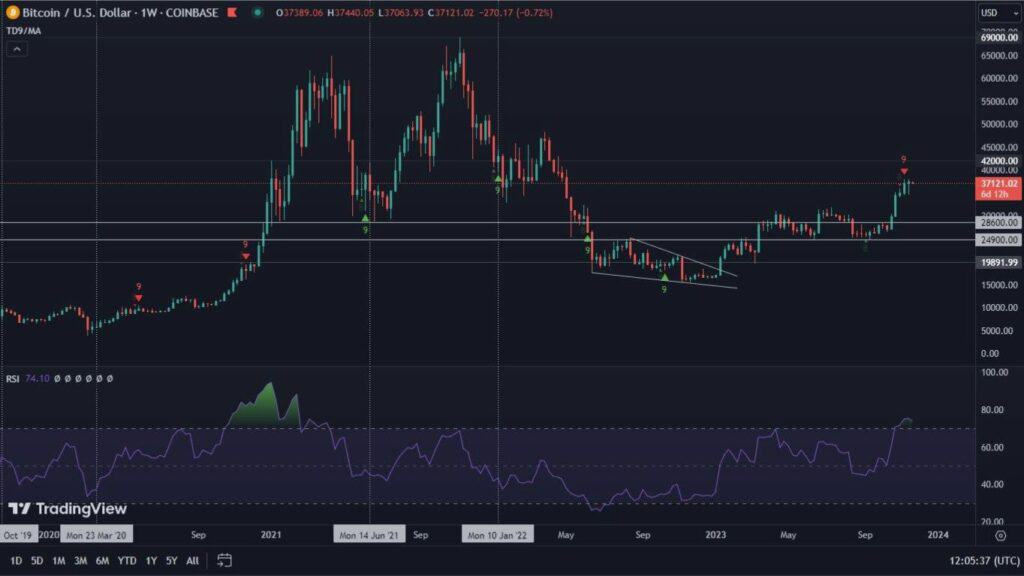
Bitcoin’s price action is currently so interesting that we will look at it from two perspectives. The first, weekly, manifests itself through a clear movement inside a descending pennant. The indicator that attracts the strongest attention is undoubtedly the MACD. It is at the threshold of a bullish intersection, which historically, on the indicated time interval, has very often heralded a longer rally.
The RSI reveals two downtrend lines, marked in two ways (dashed and solid line). Potentially, each of them could become resistance in the near term. Surprisingly low, however, is the volume. If key resistances are overcome, expectations for this indicator are much higher than currently observed.
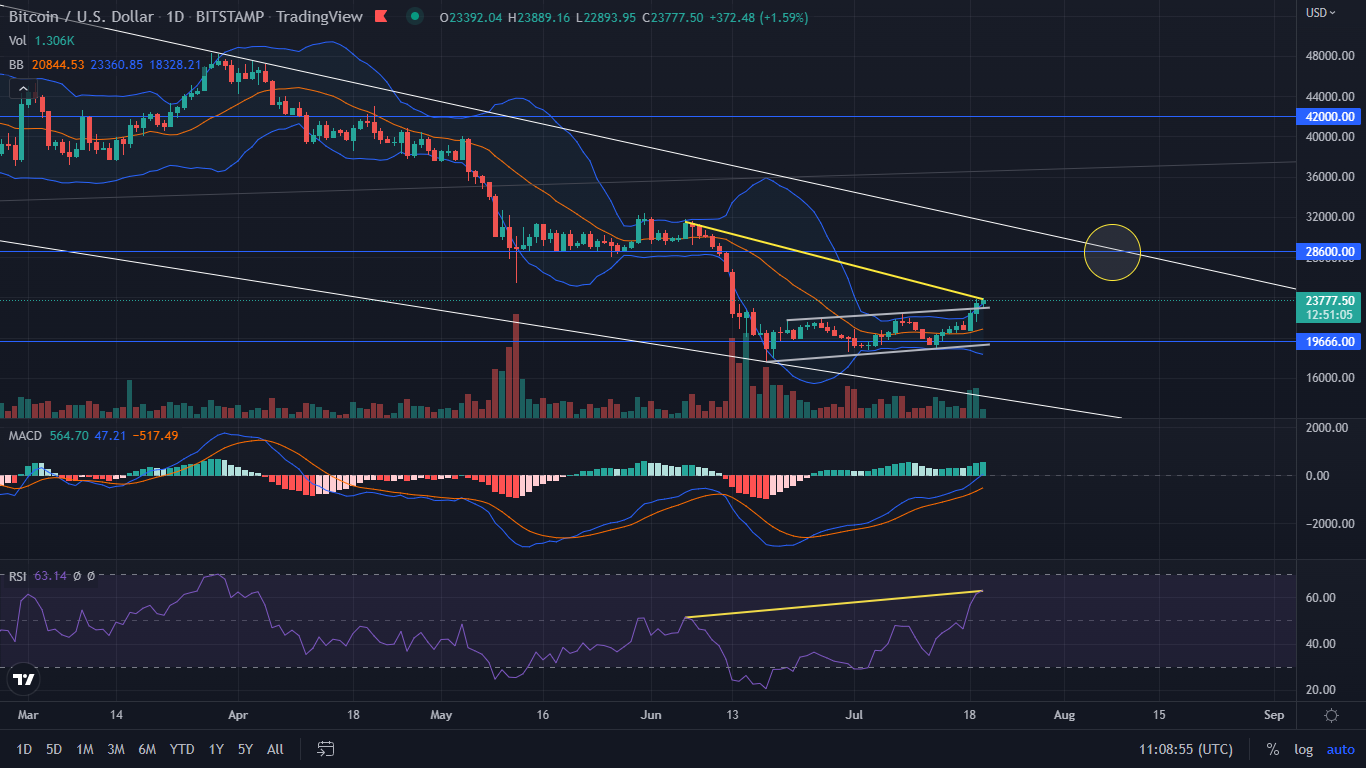
In such a case, the obvious question arises as to where the current rally may lead. It is worth noting, therefore, the aforementioned pennant structure and its upper limit. At the present time, the 20-week moving average (the orange line inside the Bollinger Bands) is also located in its vicinity. With a yellow circle, in turn, we marked the area where the confluence of these resistances is located, as well as the horizontal line of price support, for the bottom of the past year. Thus, from a medium-term perspective, $28,600 seems to be a potential limit for a short-term rally. If, in turn, the current breakout proves to be false, this year’s lows will come back into focus.
Bitcoin (BTC) on the daily chart
The daily chart here becomes an interesting complement to the weekly one. This is because it turns out that Bitcoin has broken out of the descending channel (bearish formation) upward. The volume during the breakout turns out to be somewhat more impressive. However, the breakout is accompanied by a bearish divergence, which, however, may still be growing. The price of BTC is moving beyond the Bollinger Bands, which in turn may indicate at least a short-term correction and perhaps testing the channel from the top. The ranges of the price range remain the same, as shown in the analysis based on the weekly interval.
Ethereum (ETH) leads altcoins
Ether driven by upcoming events has entrained itself in a significant rally. We wrote about the changes in the network in an article titled: “Ethereum creators confirm date for The Merge.” This information helped ETH to form a triple bottom. The total increase in the value of the coin in 7 days thus exceeded 56%. The price action brings Ethereum closer to the vicinity of $1,700. In these neighborhoods, the coin has found solid support in the past. Today, in turn, it may encounter equally strong resistance. This is confirmed by the RSI divergence. Thus, in the near term, a rebound and a test of the 2018 peak of $1,420 seems highly likely. A denial of such a scenario could be an attempt to attack $2,000.

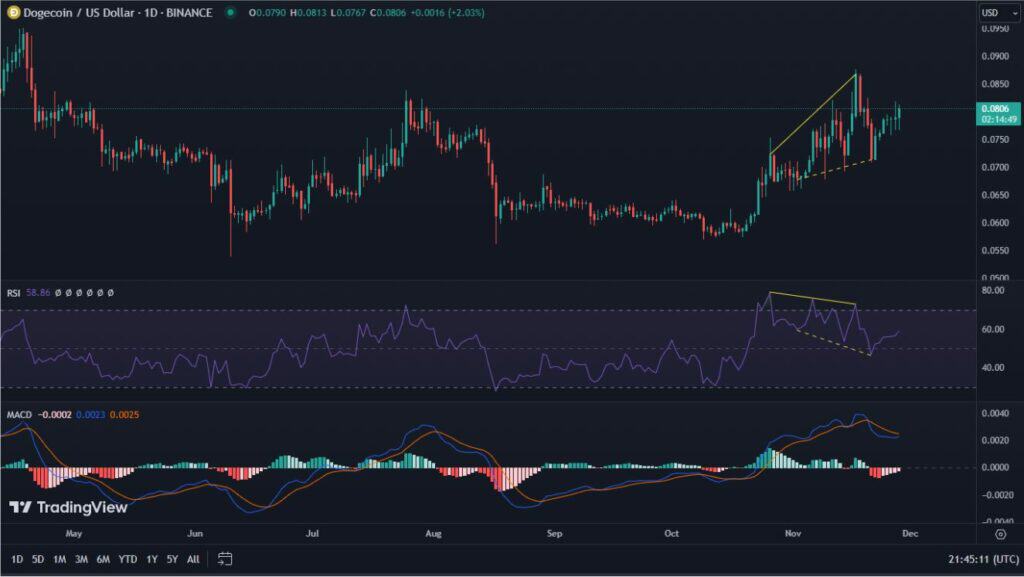
Solana (SOL) reaches the limit
A clear descending prop can also be observed on the Solana chart. It is interesting to note that SOL is consolidating below its upper limit, after rallying for 7 days and reaching an increase of 46%. This may be a signal for an upcoming breakout. If this is the case, an attack in the area of $80 seems quite likely. However, the accompanying bearish divergence in Solana has the right to push the value of the coin to levels below $30.