A long period of decline and subsequent consolidation has been overcome by Bitcoin. So, can we expect further upward movement or is this just a false breakout? Let’s check!
Higher peak and broken resistance
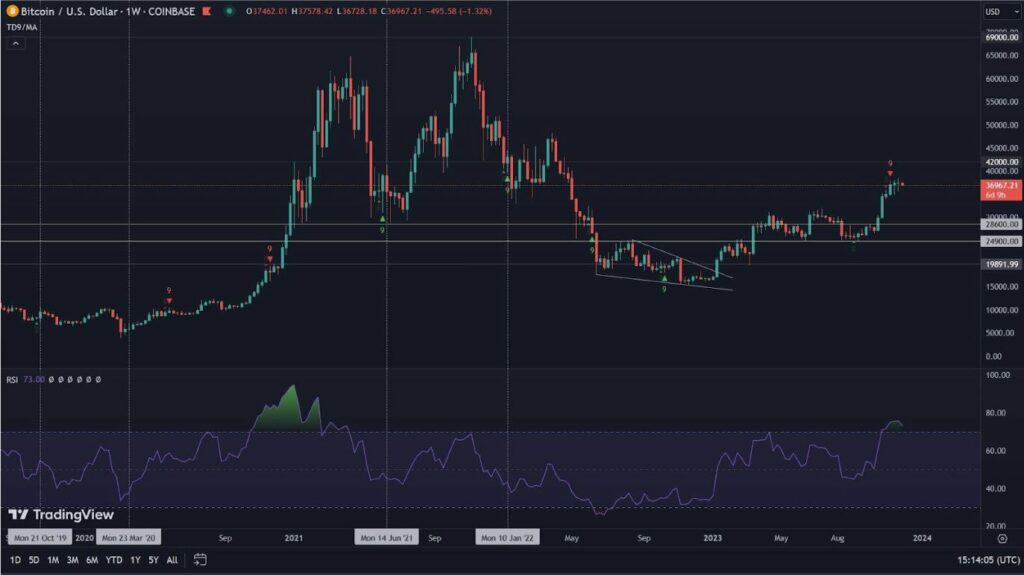
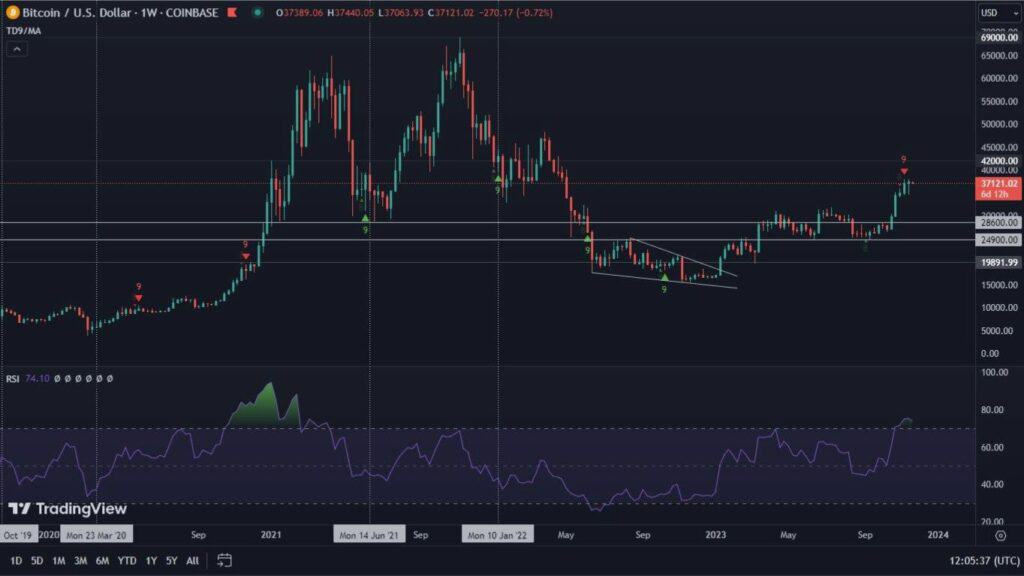
We will start the analysis from the weekly chart. It is on this chart that we observe that Bitcoin has managed to form its first higher peak in a long time (circle on the chart). Thus, we see a full pattern formed from four points – a bottom at $33,000, a first peak above $42,000, a higher low near $38,000, and the current breakout. This pattern may be the beginning of an emerging uptrend. MACD also made a bullish cross, which, historically, has heralded subsequent rallies.
Also interesting is what happened between the 20-week and 50-week exponential moving averages (green and pink lines, respectively). The sudden bullish move resulted in the avoidance of a death cross. Although EMA crosses are lagging indicators, they have historically foreshadowed further declines. Therefore, it seems that they will not happen in this case. A worrying sign, however, is the volume. This, taking into account the breakout of resistances, such as 50-day SMA, or the limit line of the formation, does not impress.

Situation on the daily chart
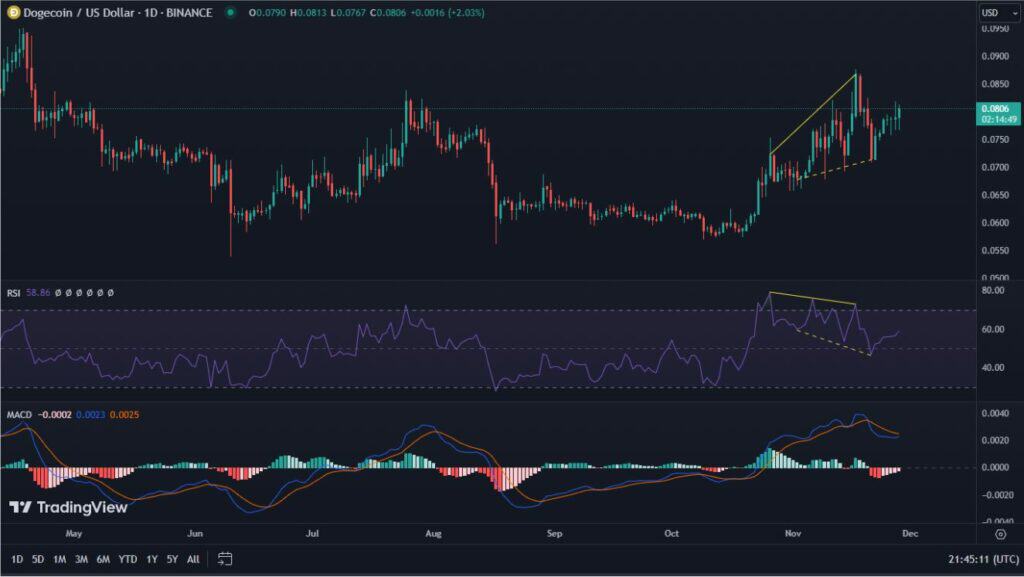
The one-day chart allows us to take a closer look at the current breakout. Let’s start with the volume and the moment when the price overcomes the key resistance, marked with a dotted line. As you can see, the strength of the buyers is not impressive. However, it increased the next day, indicating that the market was waiting for a break of the key resistance of $46,000 to follow the move. Meanwhile, there are many signs of short-term overvaluation. Let’s start with the TD Sequential indicator, which has been suggesting a correction for days now.
Moreover, Bitcoin has encountered the 200-day SMA (green line) on its way. It can also provide resistance for the price. If a bounce were to occur at this point, a fairly clear ascending channel would form, indicated by the white lines. This is a bearish formation. Thus, a potential downward scenario could take the price of BTC to its lower edge, currently located around $36,000. A bullish scenario, on the other hand, could result in a correction to the dashed line, which is the boundary of the earlier pattern, its retest as support and further upward movement. This with a breakout of the 200-day SMA and a negation of the ascending channel pattern.

Market capitalization is up
On the market capitalization chart we also observe a strong breakout. This is because it moved not only Bitcoin, but also the entire altcoin market. The descending channel was broken upwards. The value of the market, as is the case with Bitcoin, is experiencing overvaluation on the TD Sequential indicator and has also encountered the 200-day SMA (green line). This could provide another signal indicating a local correction.

Bitcoin’s Dominance
Not much has changed on the BTC dominance chart for quite some time. We continue to observe the journey of the leading cryptocurrency inside the descending triangle. Nevertheless, the 200-day SMA that Bitcoin is currently resting on is again playing an interesting role here. Historically, we have seen many reactions to it. Thus, this time too, the scenario according to which a rebound and an upward rally will occur is not out of the question.