Although Bitcoin’s total volatility in the past month was nearly 18%, it was unclear until the last moments whether February would be marked on the chart with a green or red candle. Market uncertainty remains high. So what lies ahead for the leading cryptocurrency in the coming period?
Bitcoin on the monthly chart
As every month, we begin our analysis by putting Bitcoin in a broad perspective. February ended with a price change of ≈0.0%. Depending on the exchange, this value can vary by +/-0.1%, changing the color of the observed candle. Its characteristics alone leave no illusions – this is uncertainty. The body of the candle is small, and the wicks are high and symmetrical. Bullish signals are undoubtedly the RSI divergence, as well as the bullish momentum given by the MACD.

Nevertheless, a higher top has still not been formed. A clear bearish OBV divergence has also appeared. In doing so, we are observing a rejection of the 200-week SMA. This situation over the past months does not happen for the first time.

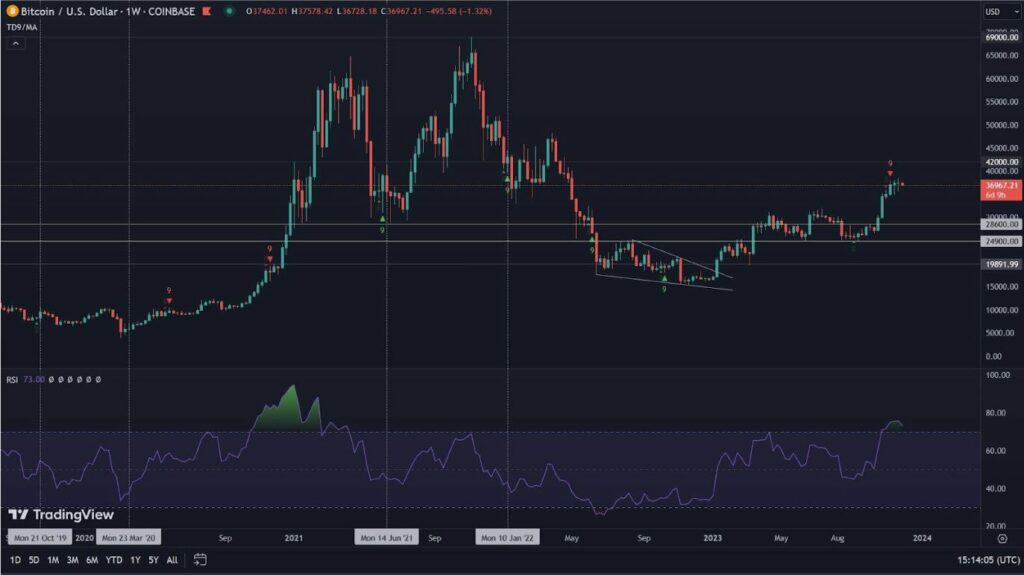
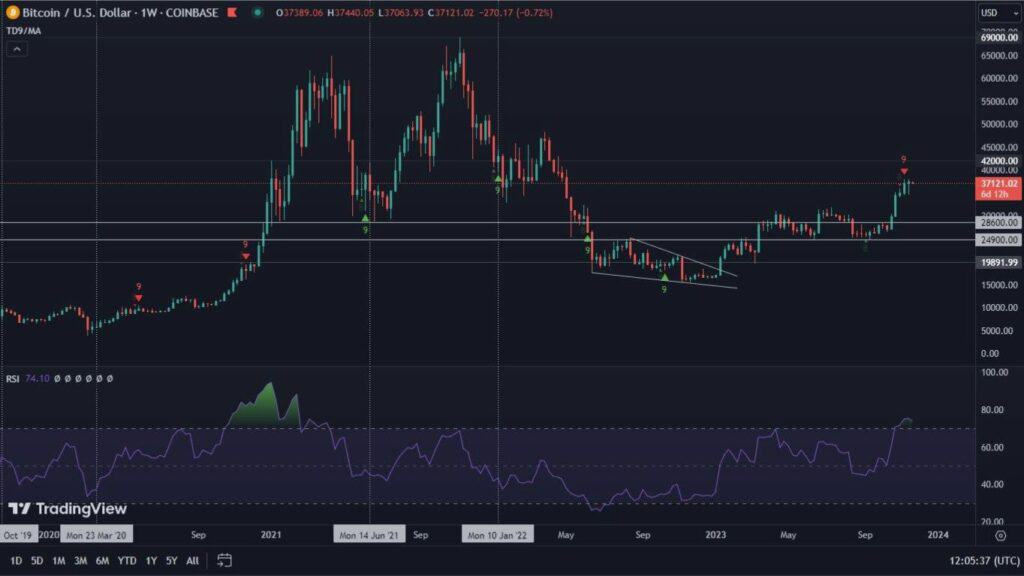
Bitcoin on the weekly chart
A lot of uncertainty and indecision is also sent by the weekly chart. While seven days ago it seemed to negate the bearish signs, they are back in play again. Bitcoin thus lost 3% of its value. MACD has returned to bearish momentum. The bearish RSI divergence, which has been reported for a long time, is steadily widening. In addition, BTC has experienced another rejection of the horizontal level of $25,200. At this point there is a convergence with the 200-week SMA. As a result, these co-movements of resistance, give it more strength. On the other hand, a positive factor is the RSI, which is currently above 56.

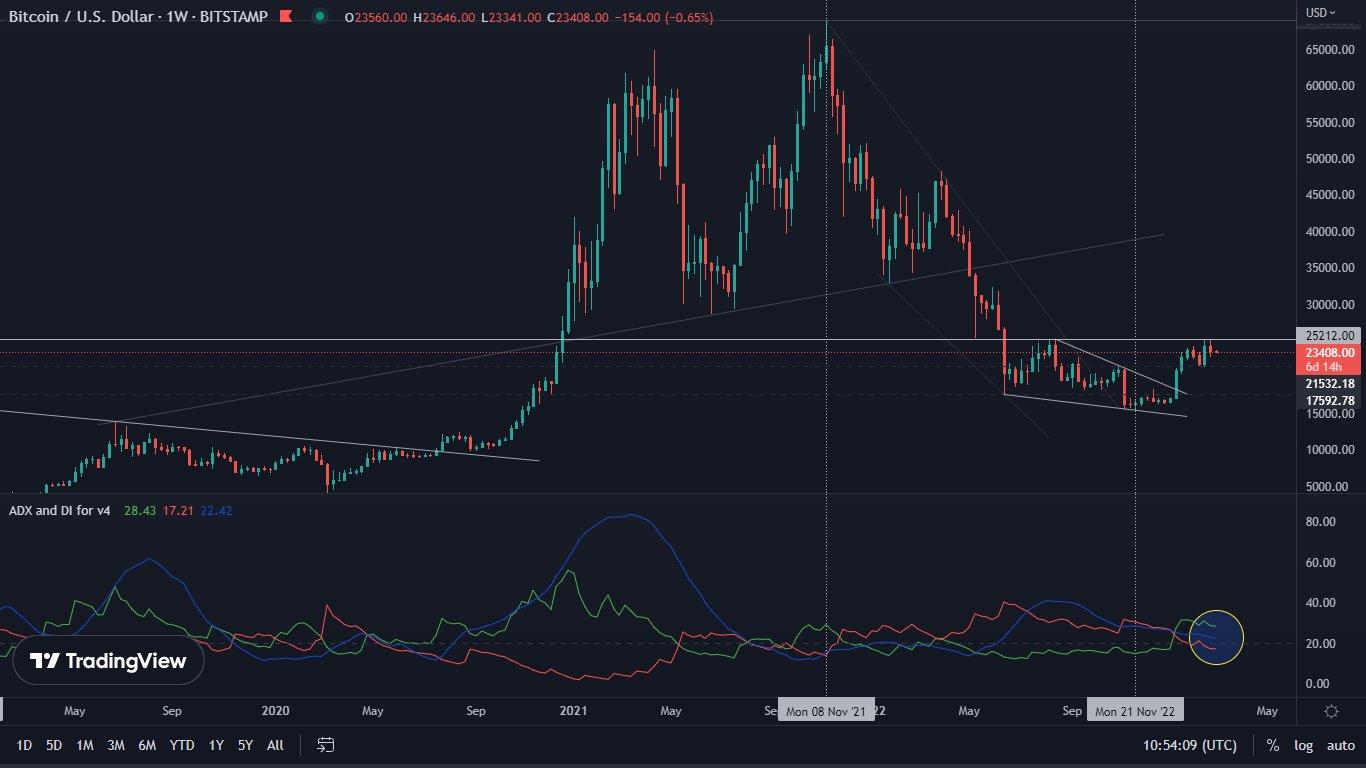
A slightly more worrisome signal is sent by the ADX indicator (blue line at the bottom). At the moment, this year’s rise so far, while maintaining valuations in February, has not resulted in its movement. This indicator is responsible for the strength of the trend. Remaining at low levels, it informs us that the movements to date were still among the weak ones. Wanting to talk about sustainable increases, this situation must improve.
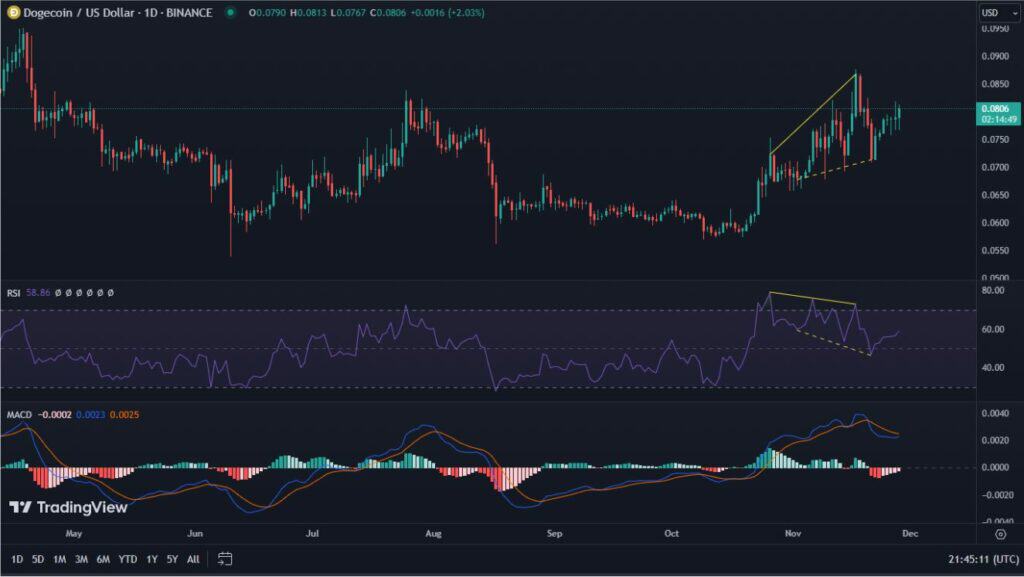
Bitcoin on the daily chart
Meanwhile, on the daily chart, the situation remains relatively unchanged. The cluster of bearish indicators marked in the previous analysis, has been extended by the MACD. Earlier we highlighted the bearish divergence of RSI and OBV. Although volatility has been reduced and the price seems to be consolidating, it is still impossible to talk about their reset.
Nevertheless, the level from which the RSI indicator is trying to bounce is particularly interesting. This is equal to 50, which very often determines what phase the market is in. Maintenance of this level gives a chance for further attacks in the northern direction. Loss is the risk of a deeper dive.

The most important levels to watch at the moment are $25,200, which is a key resistance. It is also worth keeping an eye on the CME gap, around which a lot can happen on possible declines.
The market may be determined on this occasion by the condition of the U.S. economy and, consequently, the SPX index. It is currently defending the downward trend line from under which it recently broke out. Its maintenance is crucial for the health of any asset. However, in the context of forecasts of further interest rate hikes in the United States, this may be an extremely difficult task.