The first ten days of the new year saw Bitcoin form as many as eight green candles on its chart. The total value of the increase is less impressive, as it slightly exceeds 5.5%. Meanwhile, the leading cryptocurrency found itself under a resistance zone that has been causing great difficulty for a long time.
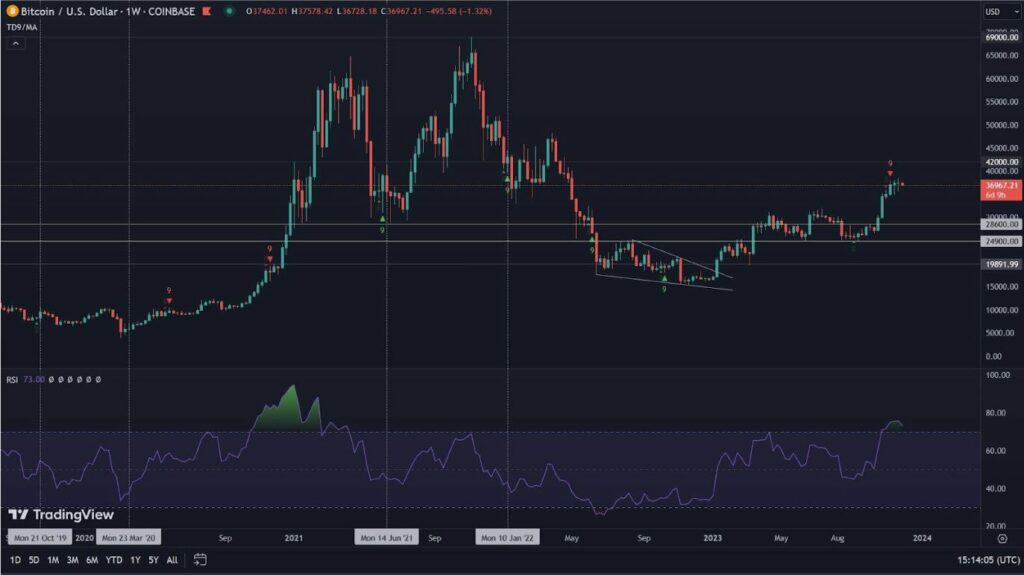
Bitcoin on the weekly chart
The first week of 2023 brought us a very significant change on the weekly chart. Well, the RSI downtrend line, which had already provided resistance for Bitcoin for 103 weeks, was pierced. However, we recommend caution, because over the past 10 weeks, this is the third attempt to overcome it. To be considered successful, the value on the indicator must also remain above this line in the current week. Otherwise, we will be dealing with a false breakout.
In addition, the past week also saw Bitcoin’s value rise by 3.05%. The falling wedge is a persistent pattern. The MACD remains positive, and the 350-week moving average, invariably provides support for the price of the asset. Unfortunately, volumes remain low. They may be excused by the fact of low volatility, with trading taking place inside the formation.
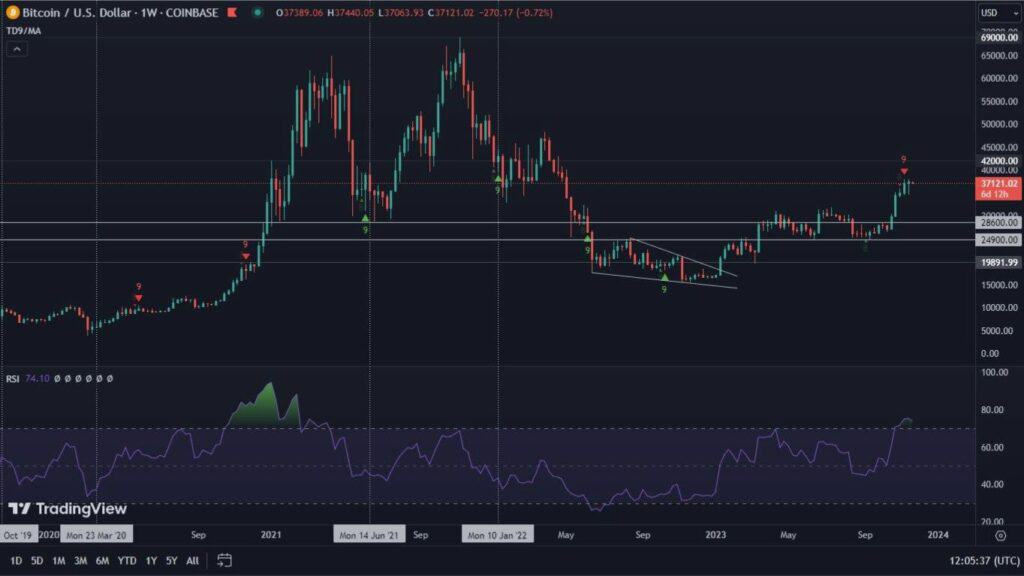
Bitcoin on the daily chart
There is definitely a lot going on here. In the introduction to this analysis, we briefly described the beginning of 2023. Looking through social media, one can see that it has caused a kind of FOMO. But was it justified? For it turns out that Bitcoin faced a huge resistance, and with this fact, there were many indicators suggesting a downward bounce, or at best a consolidation.
It is worth noting that in the gray area that marks the resistance zone, containing the bottom of last June, there is the upper boundary of the falling wedge. Such a convergence in itself increases the supply strength of this zone. From the sticky looking at the Bollinger Bands, we will notice that the price is oscillating just above their upper limit. This suggests its recurrence.

In addition, both the RSI and OBV indicators illustrate clear bearish divergences. We see them here in both hidden and regular forms. The 100-day moving average, which has been a clear resistance for the BTC price in recent months, also found itself in the resistance zone.
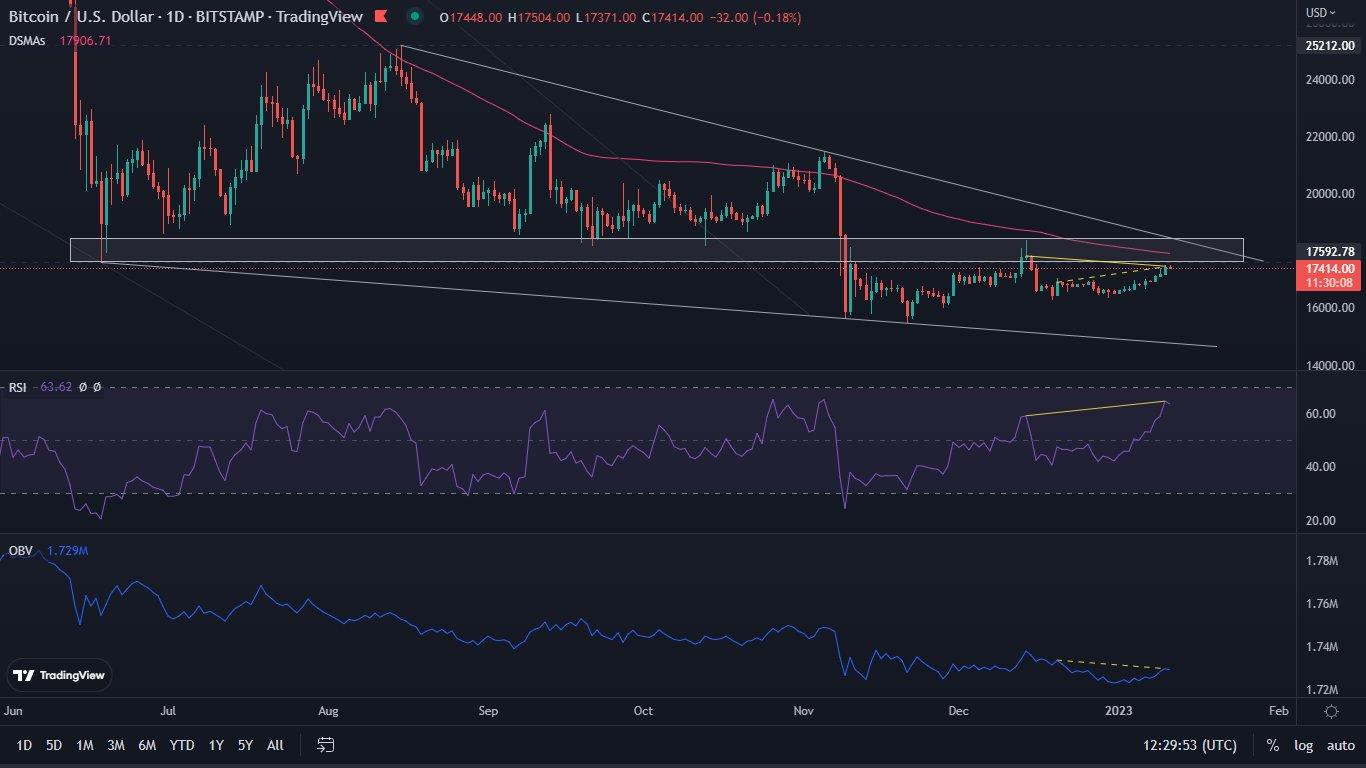
Completing our information, it is also worth looking at the TD Sequential indicator. It illustrates the attempt to form 11 green candles in a row. This tells us about the temporary overvaluation of Bitcoin and a potential reversal of the trend direction. The overvaluation is also confirmed by the stochastic RSI, which has been occupying the overbought zone for several days.

Thus, we encounter an impressive convergence of multiple bearish factors. The resistance zone therefore becomes extremely difficult to overcome. To do this, strong volume will be necessary.
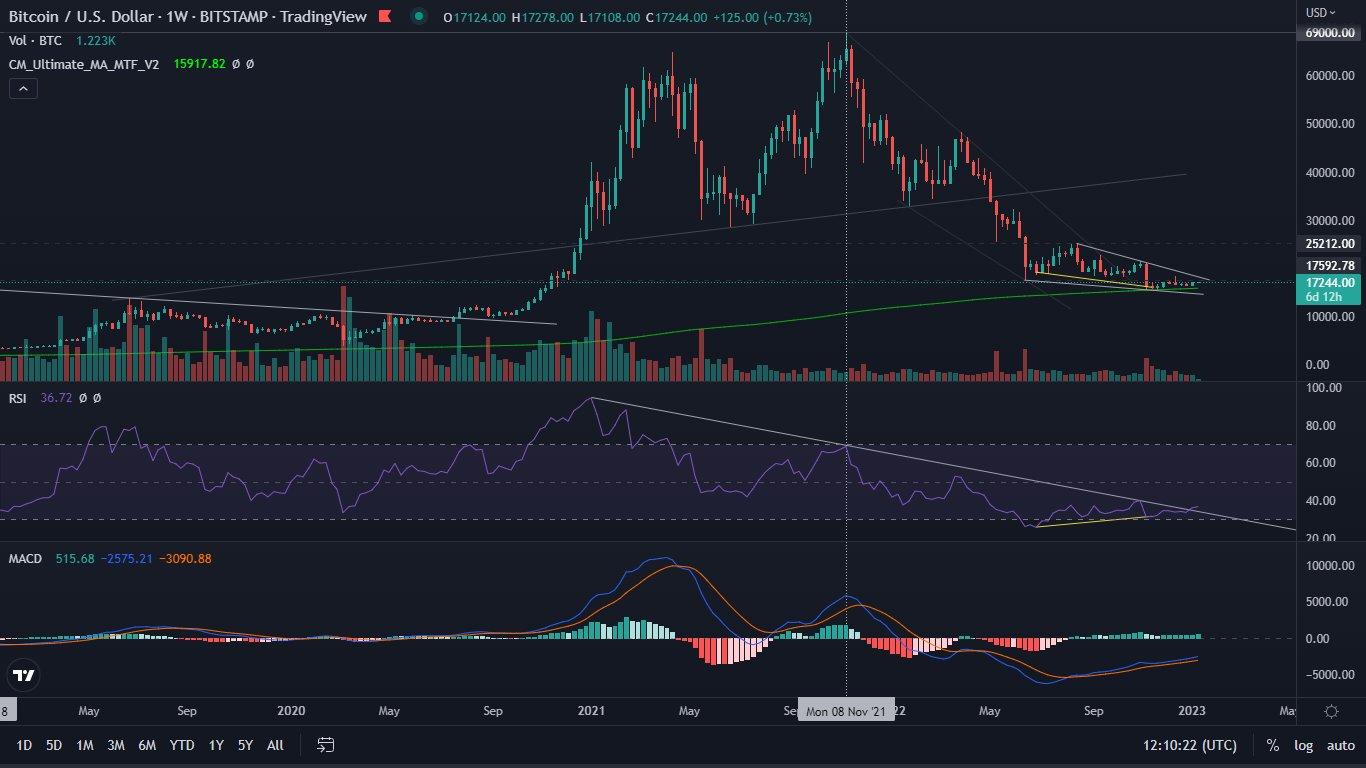
Dominance at a turning point?
An argument supporting the declines, may be the dominance of Bitcoin, which seems to be at a turning point. We can see this through the bullish RSI divergence in this case, as well as the TD Sequential.

Declines very often lead to a situation where the dominance of the leading cryptocurrency gains ground. The key day has the right to turn out to be Thursday, January 12, when inflation data will be published in the United States. This event has the right to become a catalyst for further movements.