The wide resistance zone that Bitcoin has been in for more than a week still remains unbroken. Do the bulls have enough strength to overcome it, or will the bears take the initiative? Let’s see what the indicators suggest!
Bitcoin on the weekly chart
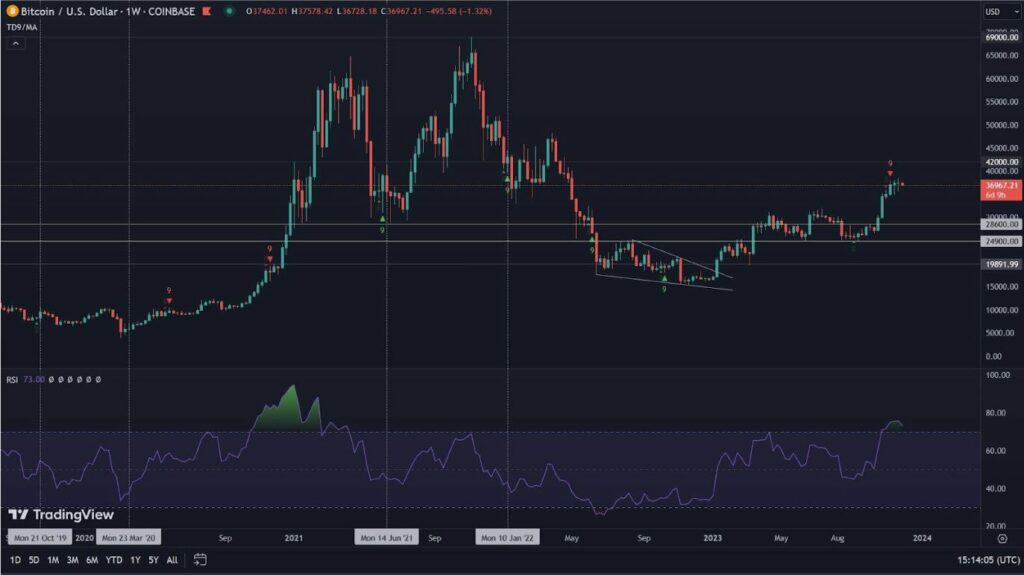
Classically, we present the weekly chart first. On it, a high increase in the price of BTC amounting to an equal 7.0%. At the same time, the RSI touched the level of 70, which is the lower limit of the overbought area. MACD again shows bullish momentum, which, with the high volatility of the indicator registered in recent months, makes it the least accurate of all those observed. Unfortunately, volumes remain very low, and the RSI shows a consistently bearish divergence, which is still likely to widen.
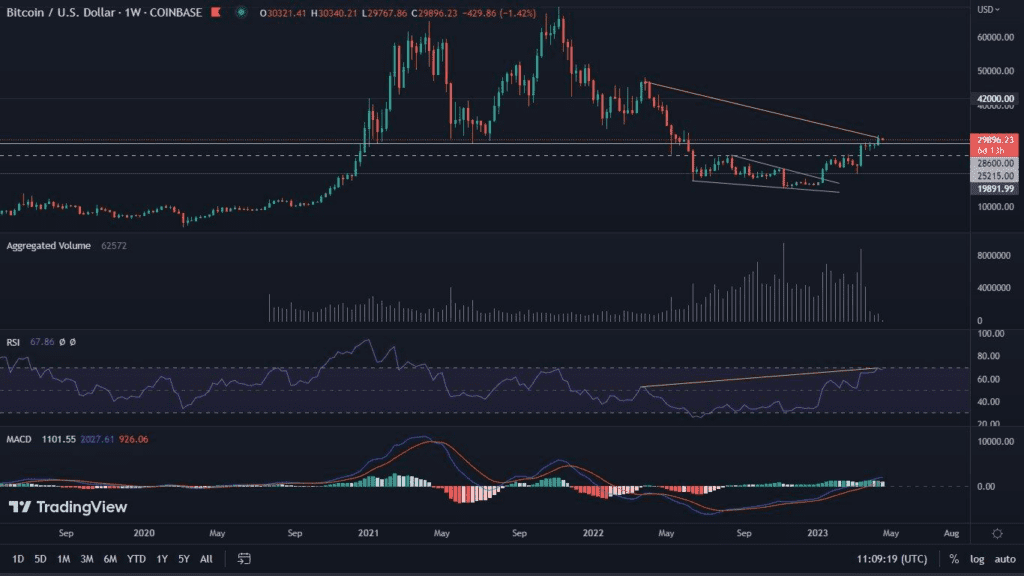
Also worth noting is the Stochastic RSI, which is forming a potential bearish cross. ADX finally made a positive move. Unfortunately, it is still quite subtle, which means that the trend is still not qualified as strong.
Two indicators triggering caution
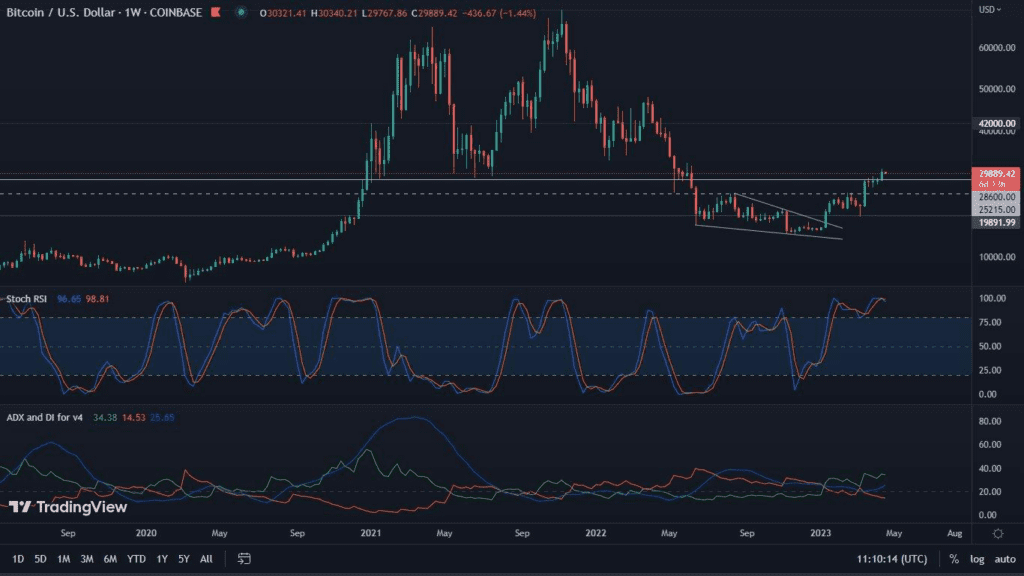
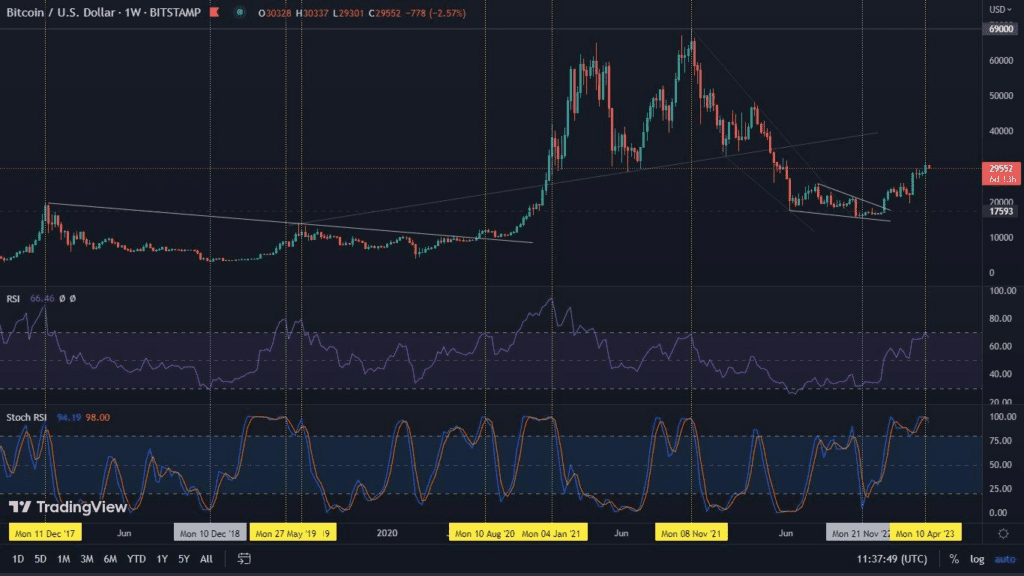
On the weekly chart, when we put together two key indicators, we can see a very interesting correlation. We are talking about the RSI and the Stochastic RSI. Every time the former was in the overbought zone, and the latter constructed its second peak in the same area, without a clear reset beforehand, Bitcoin made a correction. The shortest of these lasted up to two weeks. This situation has been repeated invariably since the peak, which was established in 2017. Given the resistance at which BTC currently stands, a repeat of such a scenario becomes highly likely.
Bitcoin on the daily chart
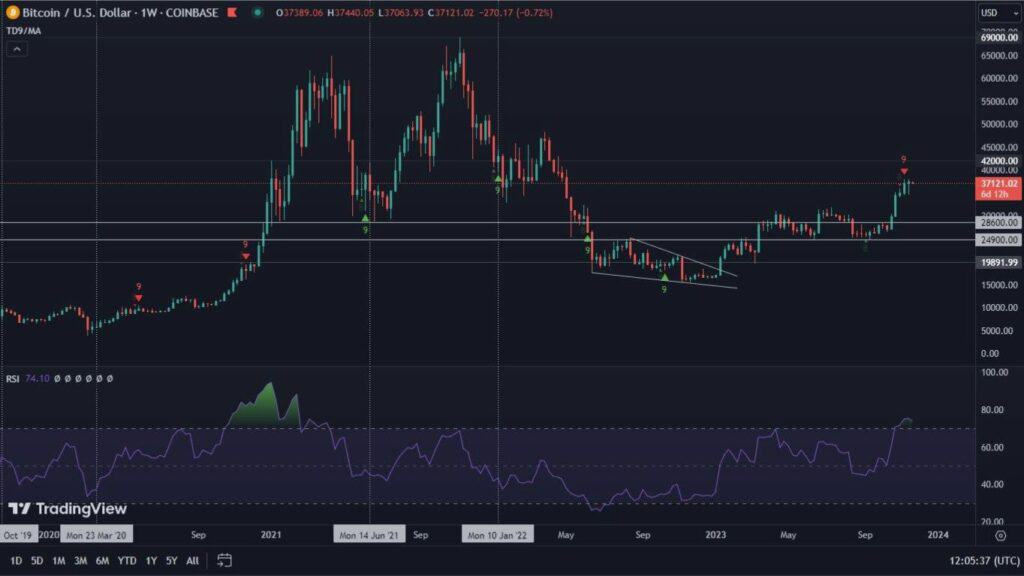
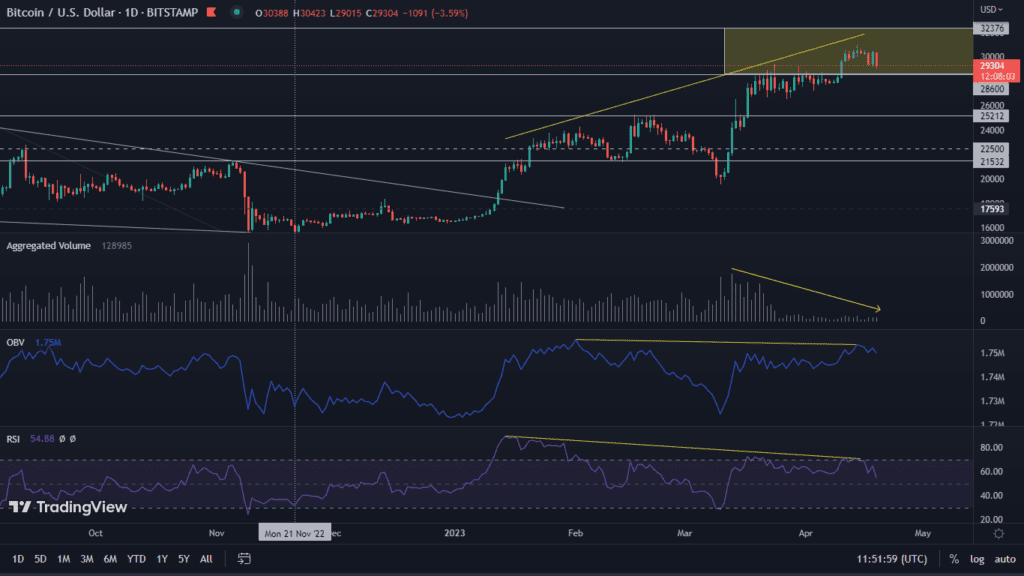
On the daily chart, indicators remain steadfast. Bitcoin, despite its long-term gains, shows a lot of weakness. The zone marked in yellow is a resistance area that requires strength to overcome. The zone takes its start near $28,600 and ends near $32,376. To successfully break through it, we would like to see a significant increase in volume. Meanwhile, for days, it has remained at this year’s lowest levels.
At the same time, the OBV indicator is showing a bearish divergence. The same is happening with the RSI. Thus, a retreat of the price to the lower areas of the zone seems highly justified. The opposite of such a scenario could be a sharp breakout to the area of $32,500-33,000. Here, however, a change in the momentum of many observed indicators is required.
Bitcoin’s dominance follows the outlined plan
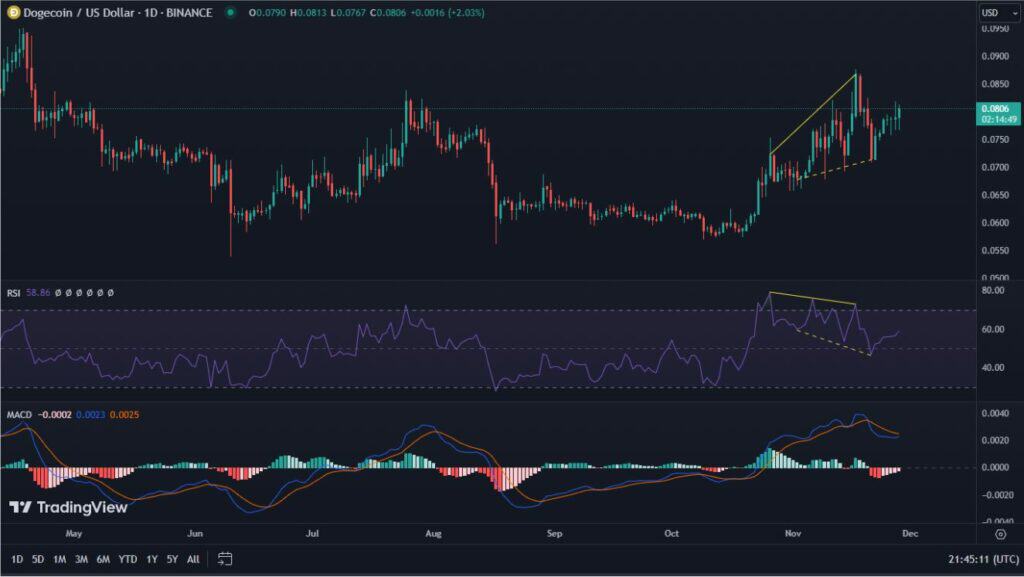
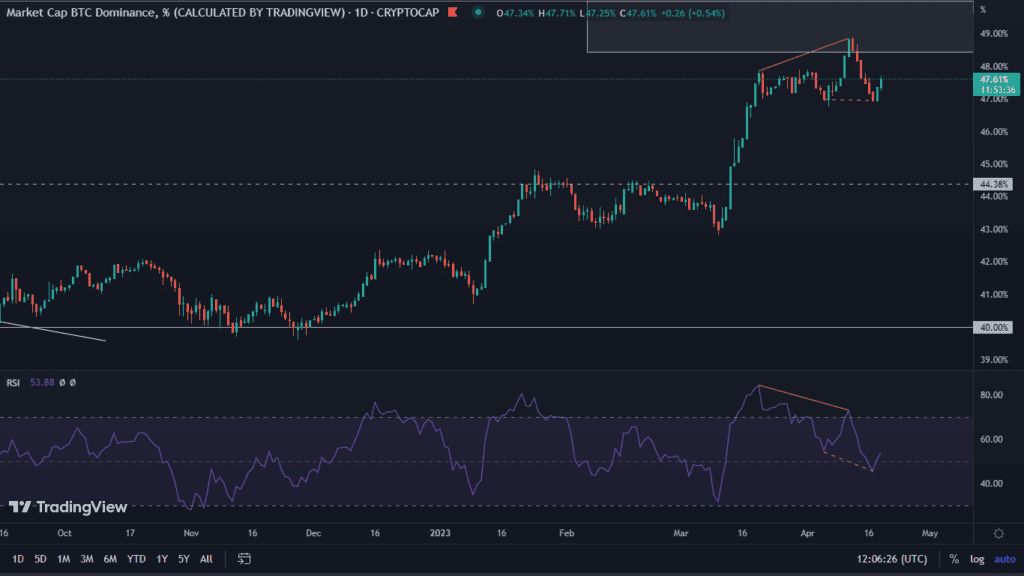
Once again, Bitcoin’s dominance chart is proving its worth. The leading cryptocurrency, while accompanied by a bearish RSI divergence, rebounded from the resistance zone and followed it downward. At this point, a bullish divergence appeared. It is definitely weaker, but enough for BTC to take control of the market again. Currently, the value of dominance is in the range where it spent a considerable amount of time until recently. Consolidation, therefore, seems to be warranted. Increases on this chart may herald an attempt to overcome the Bitcoin price resistance indicated above. Declines, on the other hand, are a chance for altcoin to gain a little more strength.
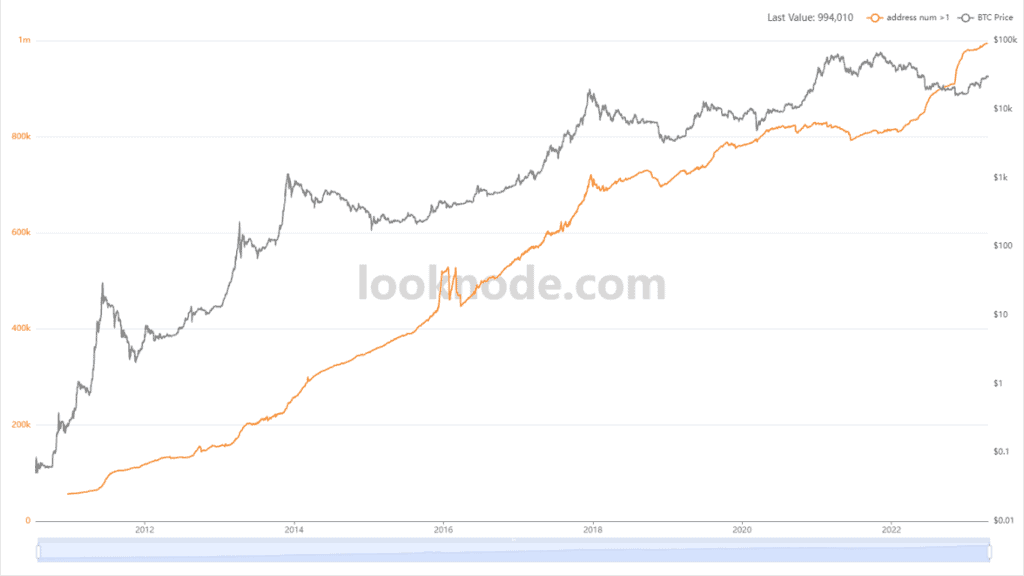
Bitcoin on its way to its first million
Bitcoin, meanwhile, is on its way to a million regardless of the price action. However, we are not talking about the value denominated in any of the fiat currencies, but the number of wallets boasting a minimum of 1 BTC. Thanks to the data provided by the Looknode.com platform, we can observe this process. The current number of the aforementioned addresses is 993,457, which means that there is really not much left to reach the goal.