The descending channel formation that Bitcoin has been in for more than two months has just been overcome. The effect of this is that the leading cryptocurrency is eliminating further significant resistance levels. The ease with which this process is proceeding suggests that the $30,000 mark may soon be broken through.
Bitcoin on the weekly chart
We begin our assessment of Bitcoin’s condition with the weekly chart and the situation we found after Sunday’s close of the trading session.
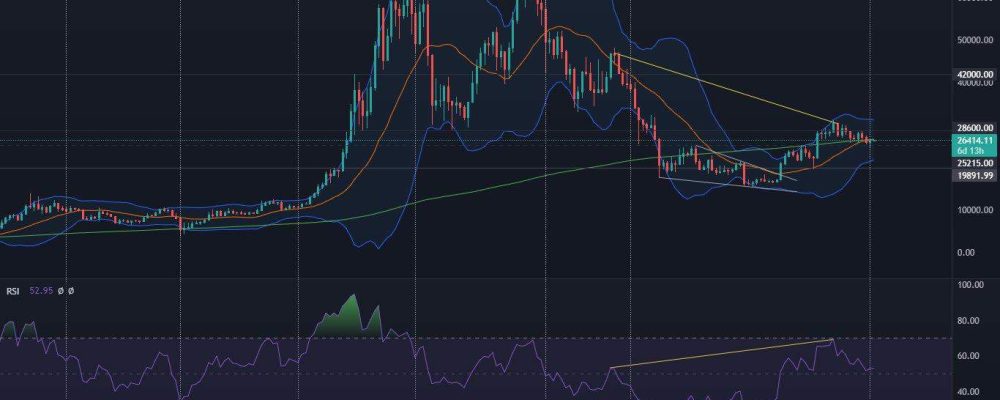
The first thing that strikes our eye is the value of BTC’s growth, which amounted to 1.5%. By the same token, the RSI also managed to maintain a healthy level, at 52. Nevertheless, we still see a bearish RSI divergence on the chart. At the close of the weekly candle, BTC was also below the 200-week SMA. The 20-week SMA (inside the Bollinger Bands) found a correlation with this moving average. The convergence of these factors has the right to provide strong resistance in such a situation.
However, as we know, the beginning of the new week brought a significant breakout. Therefore, if the price remains in higher areas, it will be a very bullish sign, suggesting a potential continuation. This means that the close of the next week, will be an event of very high importance.
Bitcoin on the daily chart
Meanwhile, the daily chart, is a manifestation of bullish strength. Here we observe a breakthrough of the upper limit of the descending channel, in which BTC has held for more than two months. Importantly, the 100-day moving average, which has so far been a strong level of both support and resistance, has also been overcome. A breakout above these areas suggests that Bitcoin intends to glide much higher. For this to happen, however, confirmation of this strength is necessary. The leading cryptocurrency can do this even in the situation of a possible correction. Thus, the area between $27,000 and $27,700, at the moment, looks interesting as a potential place to buy during a possible price pullback.
A continuation of the breakout, on the other hand, could take Bitcoin all the way to the level of this year’s highs, located slightly above $31,000. The behavior of the indicators in this zone will confirm, or not, whether it will be possible to explore the higher space.
Bitcoin achieves dominance not seen in more than two years
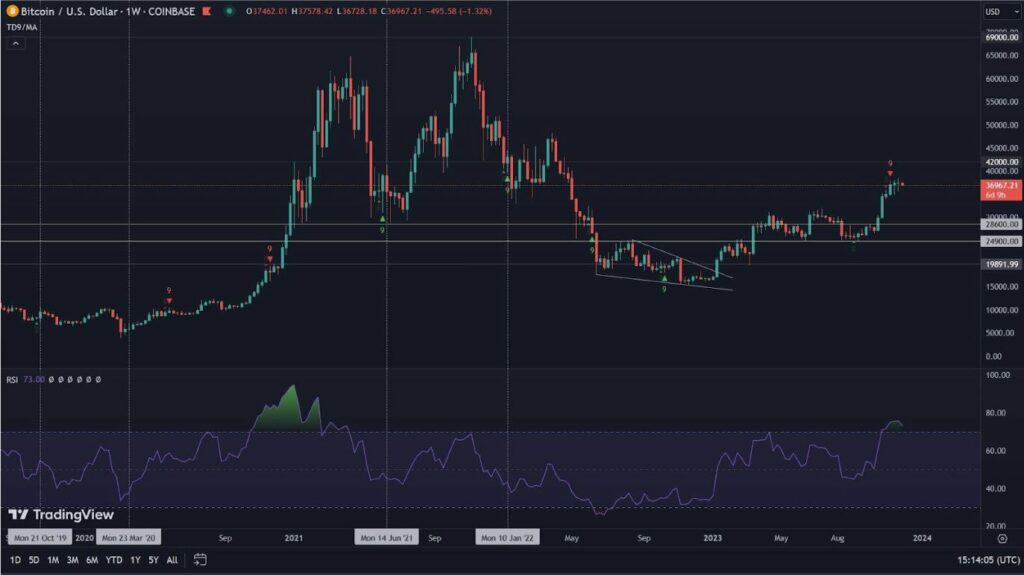
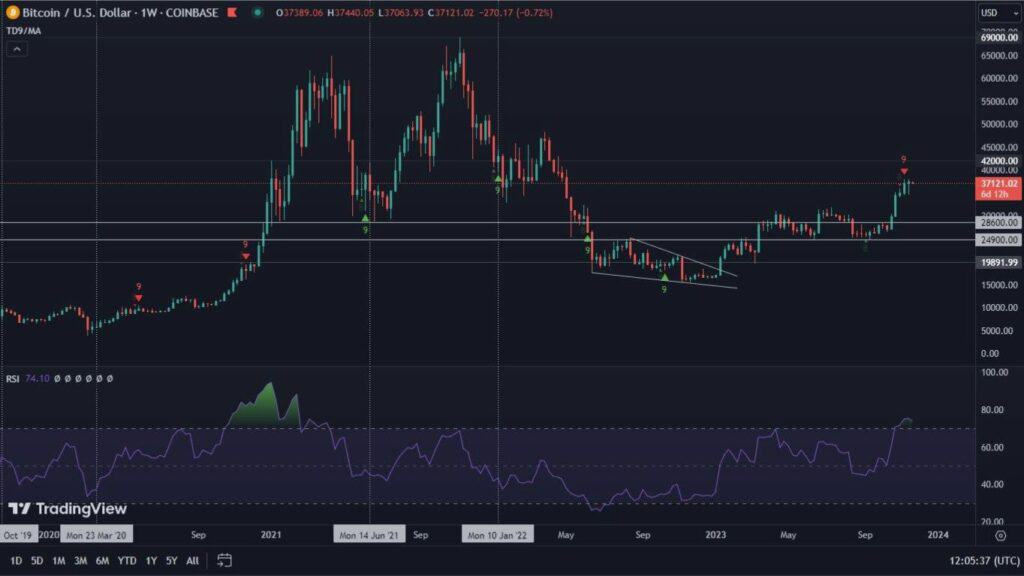
At the time of writing this analysis, as much as 51% of the value of the entire cryptocurrency market is located in the oldest cryptocurrency, Bitcoin. Such a high level of interest in BTC was last seen in April 2021. This is perfectly presented in the weekly chart below. On it we see, marked with a rectangle, a resistance zone. We have discussed it many times before and pointed out that just below it, on lower time intervals, Bitcoin formed a bullish flag. This one eventually resulted in an attack and a successful breakthrough of the psychological 50% barrier. The ADX indicator added below suggests that the trend is sustainable and strong. For Bitcoin, this could mean an attempt to attack the 57% dominance. Of course, this is at least a medium-term prospect, as there is local resistance at 52% on the way.
What about altoins?
With bitcoin dominating the market, altcoins are clearly suffering. This suffering can be observed not only against the USD but especially against BTC. The series of accusations that the SEC has made against many exchanges and consequently smaller coins is causing them to lose in the eyes of investors. Until these situations are clarified, it will be difficult to count on solid increases in their area. The upcoming XRP verdict, on the other hand, may come to the rescue. Its outcome may temporarily tip the scales in favor of smaller coins.

