What was previously taken for granted has been irreparably affected. For the first time in its history, Bitcoin has fallen below the peak of the previous cycle. Let’s see if this all-important test of a key level will provide a sustained rebound. Interestingly, altcoins are behaving in an unusual manner at the same time.
The beginning of a new era
After the events of the past weekend, one of the main narratives associated with Bitcoin ceased to exist. BTC fell to the level of $17,592.78 and thus set a new price minimum of the ongoing declines. This is an unprecedented event, which causes the opinion that the leading cryptocurrency is not able to go below the peak of the previous cycle in terms of price to collapse completely. These events were undoubtedly influenced by the huge sell-off that occurred at the end of the week on the Canadian ETF. Nearly 24,000 BTC were sold there, setting off an avalanche. Is demand cheap to keep up with supply?
Price action on the Bitcoin chart
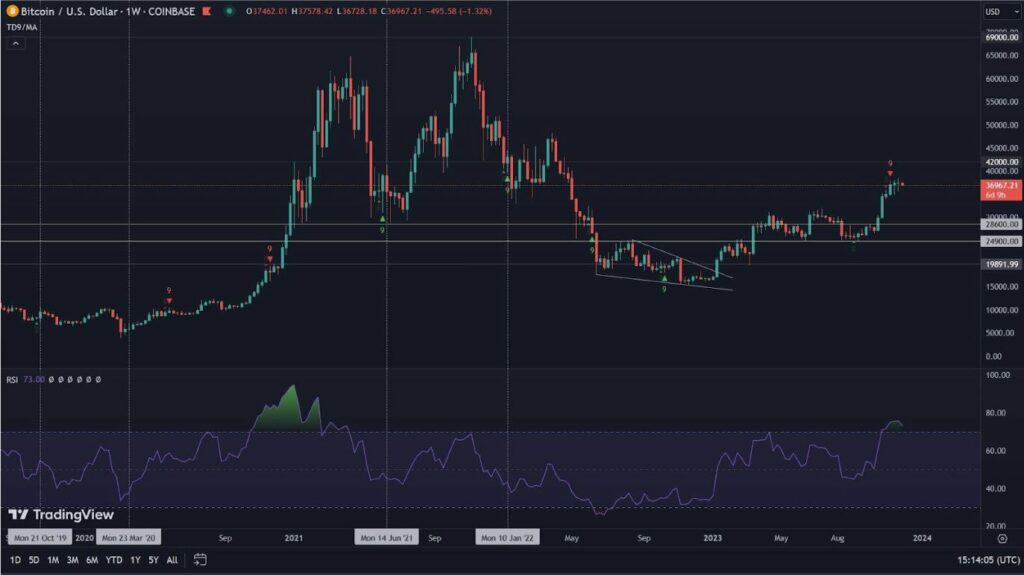
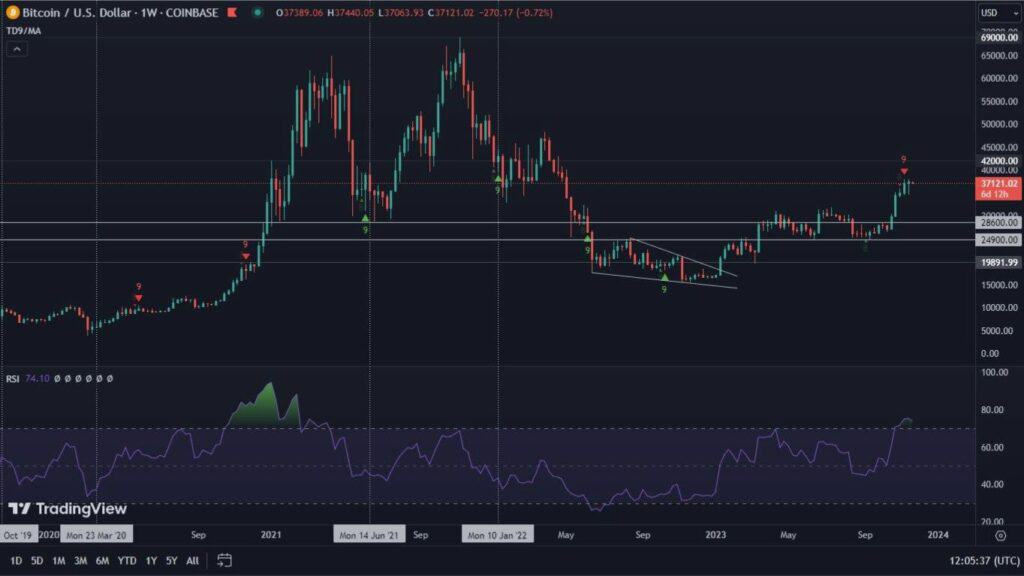
This time we will start by presenting the situation on the weekly chart. Here we can clearly see the fierce defense of the aforementioned 2017 peak. The price, despite the declines, has clearly closed above this area, which confirms its relevance as a strong level that is now becoming support. Through the TD Sequential, we are also observing a strong oversold condition, which should indicate an upcoming deceleration of downward movement. However, this indicator by itself is sometimes insufficient. RSI and MACD have dropped to all-time lows. Such moves usually also result in a trend reversal. Unfortunately, the volumes are not encouraging so far.

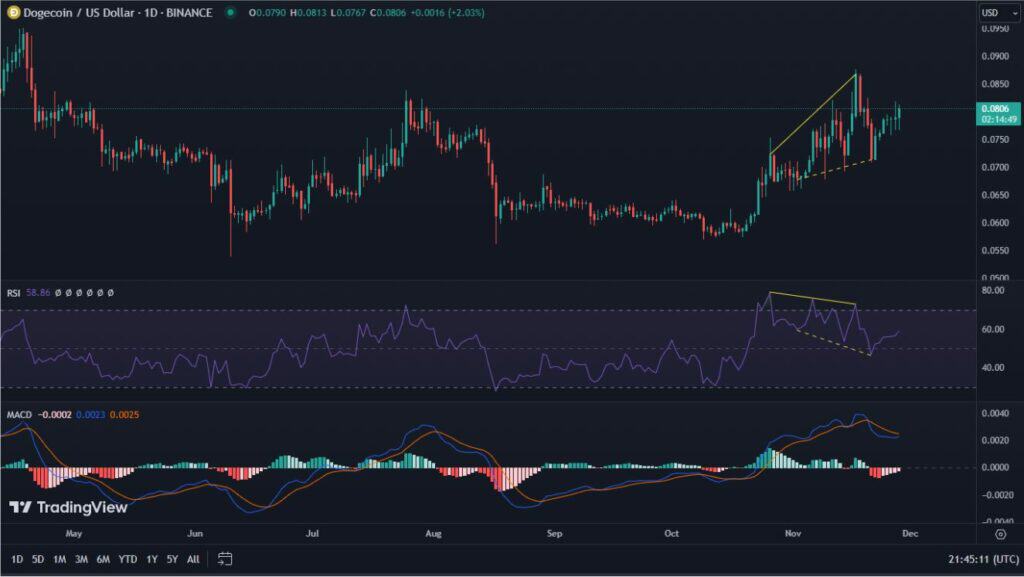
On the other hand, slightly higher bars can be observed on the daily chart. What is important, however, is that they are getting lower every day, while the price is rising. This is a significant divergence which is also visible on the RSI indicator. The MACD, on the other hand, looks bullish. In the face of so many elements, it is also worth looking at the 200-week moving average (green line). To enter the upward path Bitcoin must permanently cross it. If it becomes resistance, on the other hand, we can expect a further struggle to hold the $20,000 level, or even declines to the area between $16,000-17,000.
The market capitulates and Bitcoin’s domination follows it
A very unusual behavior can be observed on the Bitcoin dominance chart. While the cryptocurrency market is pervasively in the red, Bitcoin being the leading coin should be increasing its dominance. Meanwhile, the opposite is happening. We can clearly see that its position is steadily weakening, while altcoins are gaining in their capitalization. The RSI bullish divergence is growing. MACD is also starting to look favorable for the king of cryptocurrencies.

Why are altcoins gaining strength despite this?
The answer to this question is stablecoins. As we know they are part of the altcoins. Therefore, in order to determine the real strength of the volatile assets, it is necessary to remove from the chart those that are immutable. Thus, for the first time we look at the BTC dominance chart, from which we excluded 4 stablecoins, with the highest market capitalization (USDT, USDC, BUSD and DAI).
With this, we can clearly see that BTC’s dominance has increased significantly and is just testing the 52-53% area from the top. A bullish divergence is also emerging suggesting further upside for it. Perhaps, thus, the dips in the market. However, it is possible to go down to the 50% level, as this is a psychological limit for investors. The furthest from this region we expect the continuation of the upward movement.