Once again, the leading cryptocurrency is behaving in accordance with our predictions. Bitcoin has thus entered a local downtrend, while drawing a clearly bullish formation. However, before it is played out, an even deeper dive is possible.
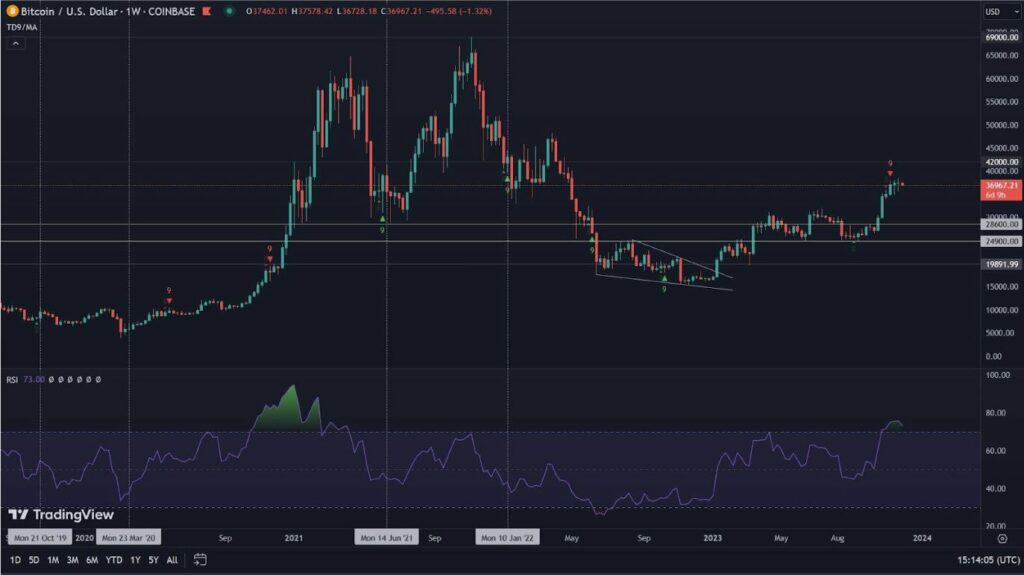
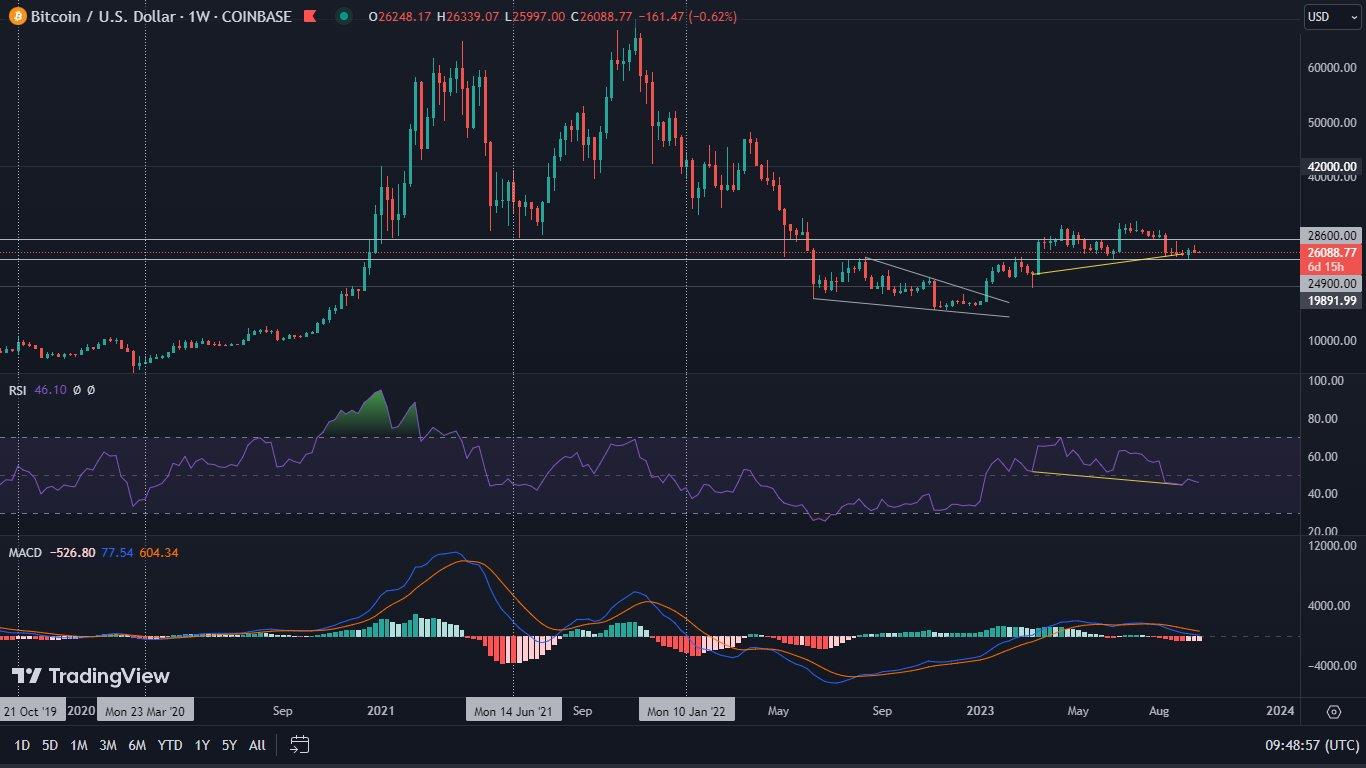
Bitcoin on the weekly chart
Bitcoin on the weekly interval made a slight decline of 1.05%. This caused the RSI value to be lowered as well, so that it is currently trading at 46. As we mentioned in earlier analyses, this region favors the bears, which supports the supply side.
Nevertheless, it is important to note that the RSI bullish divergence is invariably present on the chart. The whole thing, on the other hand, is complemented by the MACD, which in the current situation still maintains a weak but bullish momentum.
Focusing on key horizontal price levels, special attention should be paid to the value of $28,600, which represents resistance. Support, on the other hand, is the $24,900 region.
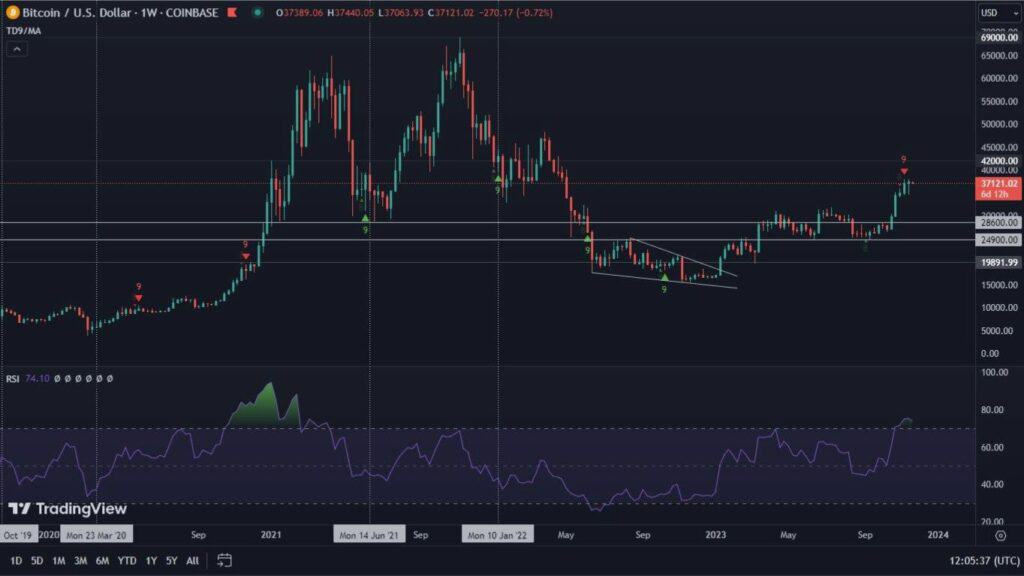
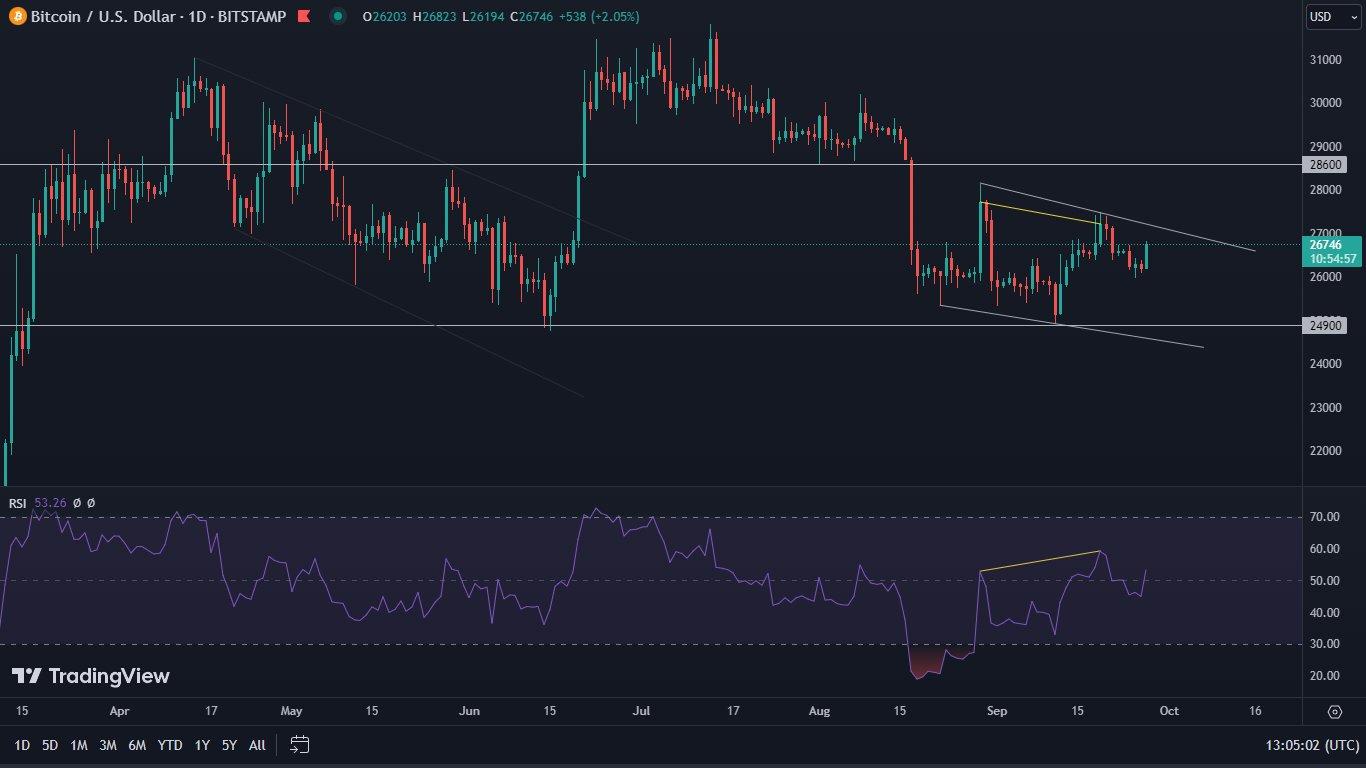
Bitcoin on a daily chart
Through the daily interval, Bitcoin sends us a bit more signals. First of all, the bearish RSI divergence, which we reported on in the previous analysis, has played out. This resulted in declines, to the levels currently observed. This divergence contributed to another important issue. Well, its presence resulted in the appearance of a clear descending channel on the Bitcoin chart. It obviously speaks in favor of potential increases. However, it is worth not forgetting its structure, which indicates that an even deeper dive is possible. Such could send the value of BTC even to levels near $24,000. Importantly – the aforementioned bullish structure of the formation, would then not be violated.
Nevertheless, the presented scenario could result in a breach of the horizontal support level, near $24,900. A false breakout would not be excluded in this case. The whole thing would certainly be complemented by a bullish RSI divergence, which would support the rebound from the lows, and which could have an impact on a further upward breakout of the formation.
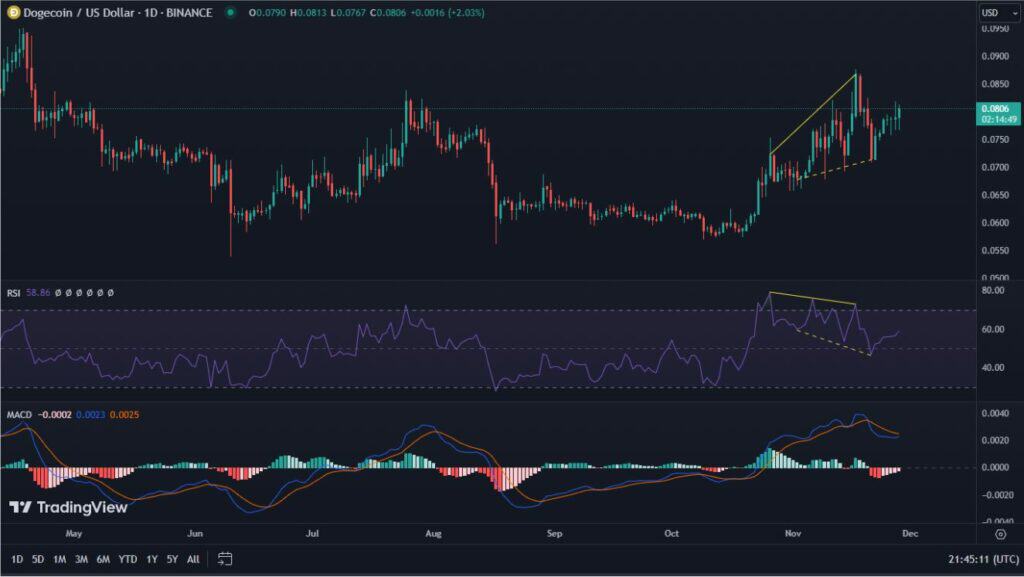
Bitcoin’s dominance on the ready for a move
While the chart of BTC to the USD seems quite clear, the chart of the dominance of the leading cryptocurrency sends volatile signals. We can clearly see that Bitcoin is dancing between moving averages on it. When we created the previous analysis, we drew attention to the 100-day SMA (yellow line), which at that moment was pierced. This breakout turned out to be false, resulting in a renewed decline in the value of the cryptocurrency’s capitalization to the level of the 50-day SMA (red line). Just below it, on the other hand, one can notice the 200-day SMA (green line), which could be another potential support point.
A slight bullish RSI divergence completes the whole picture. Unfortunately, it is opposed by MACD, which recently made a bearish cross.
Signals, therefore, are not clear. The false breakout above the 100-day SMA, with the MACD currently accompanying the shape, indicate a chance to take profits in altcoin trading. However, this period may be extremely short, as evidenced by the proximity of the 50-day SMA, as well as the 200-day SMA that follows it.
We think that as long as bitcoin does not break out of the embrace of these moving averages, it will be difficult to point out the direction in which its dominance will follow.