Bitcoin has been in a consolidation for quite some time, which is taking the character of an upward channel. Is it an accumulation, however, or a distribution? In this material we will look at the indicators and try to draw the right conclusions.
Bitcoin on the monthly chart
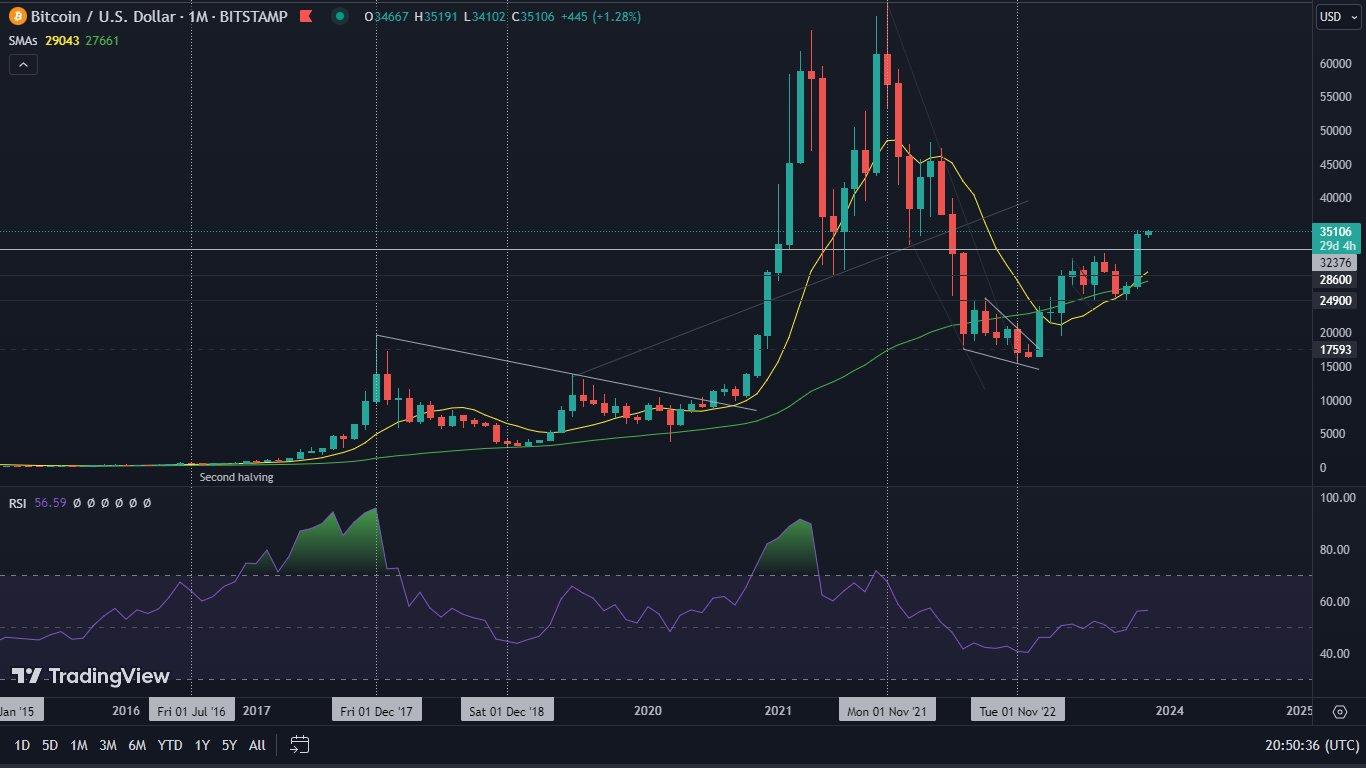
We conducted our previous analysis on the last day of October. For this reason, it is worth looking at Bitcoin’s situation first from the perspective of the monthly chart.
Well, the month, which historically is considered very bullish, actually managed to close extremely favorably for the king of cryptocurrencies. Indeed, the value of BTC increased by 28.5%, which is a fantastic result. We can observe a bullish cross between MA10 and MA20, with the shorter of the two indicated moving averages confirmed as support. In addition, the RSI managed to rise above the 56 level.
Thus, in the current situation, it is difficult to see any worrisome signals. What should catch our attention, however, is the price area in which BTC managed to find itself. Looking back, one gets the impression that this is a potential resistance zone, which was marked by clear candle closures observed in the summer of 2021.
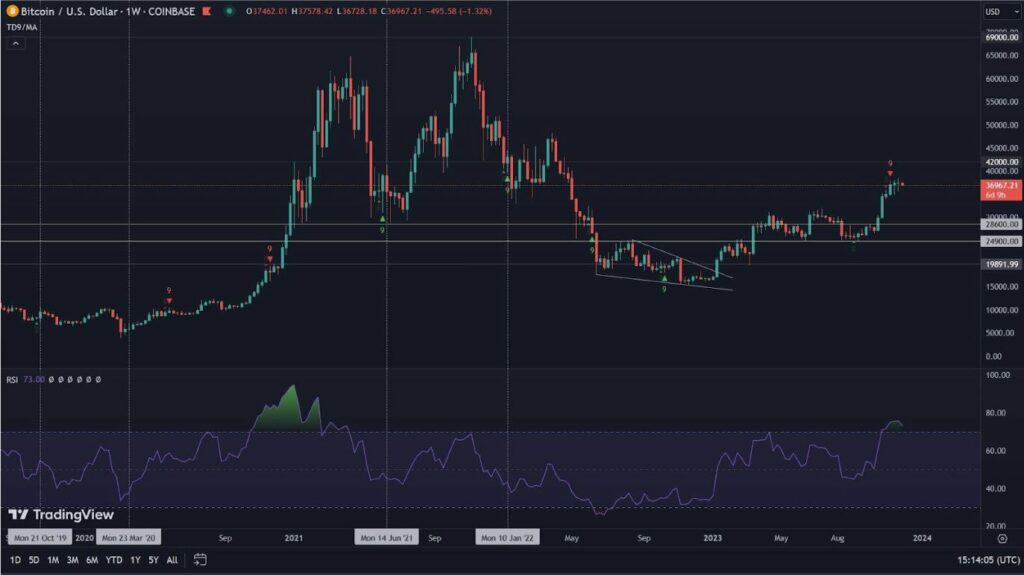
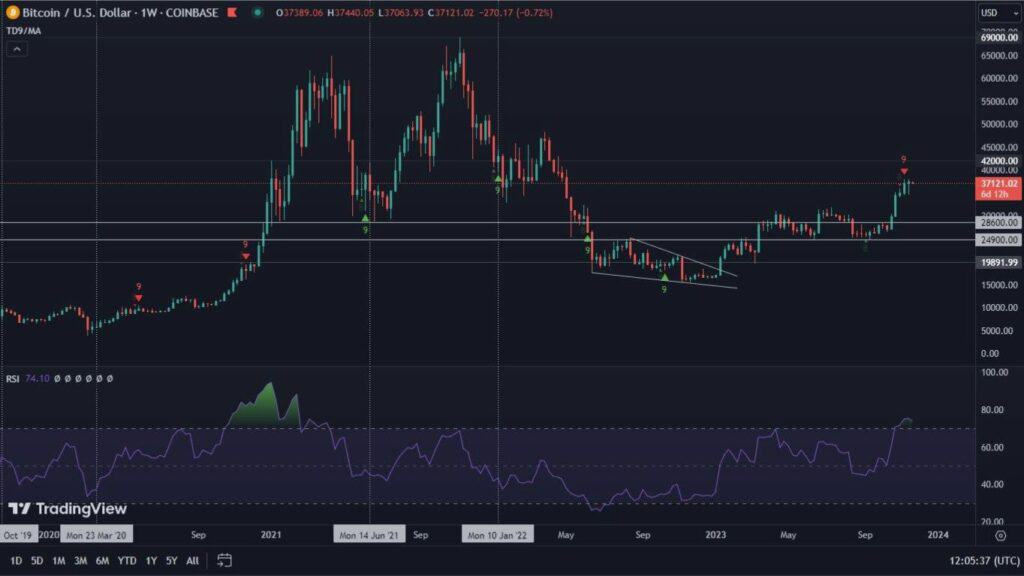
Bitcoin on the weekly chart
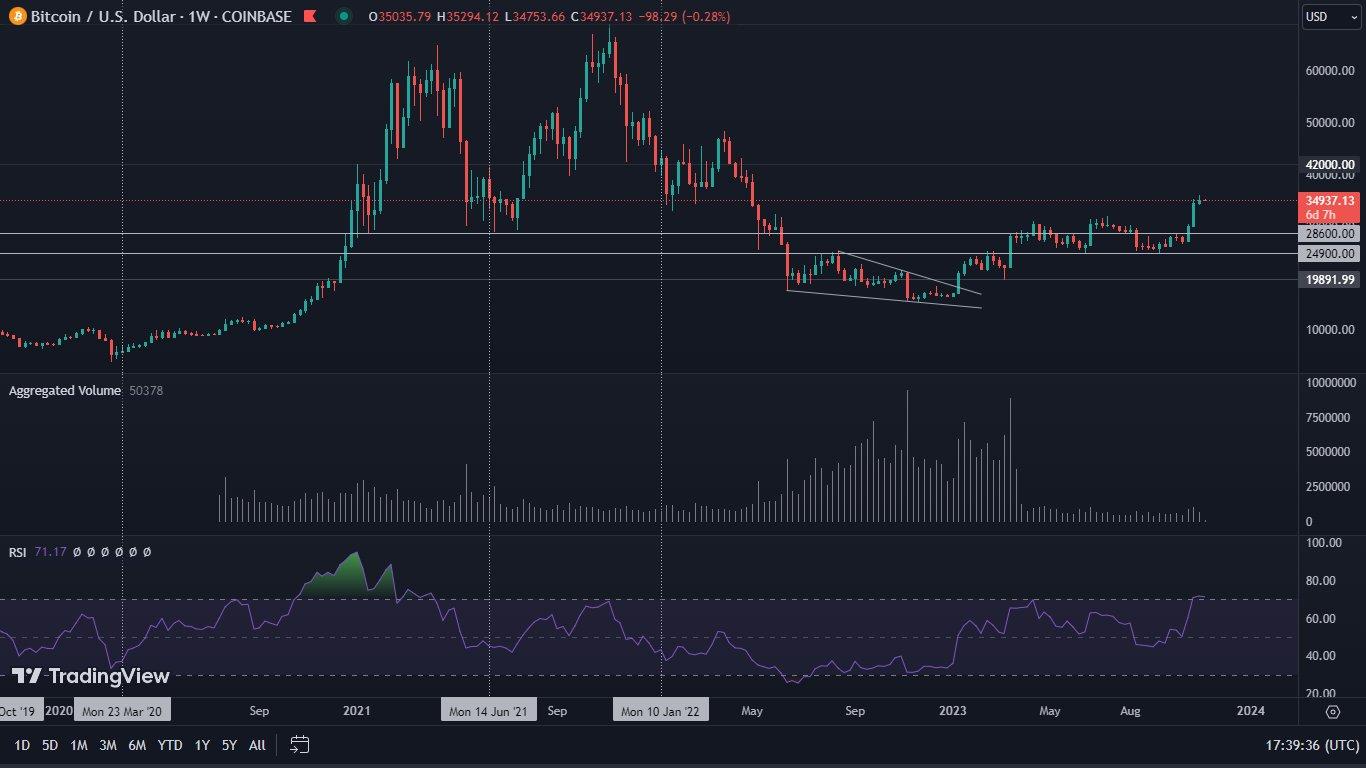
On the weekly chart of BTC, compared to the corresponding period presented in the previous publication, it is difficult to see major changes. The movements we observe can be considered relatively small. Despite the fact that the price of Bitcoin rose by 1.45%, most indicators remained unmoved. However, it is worth noting that the RSI managed to rise slightly, reaching the level of 71. In turn, the price level of $32,300 was not directly tested as support. Nevertheless, Bitcoin’s value remains clearly above it, which in itself lends credence to the breakout.
A warning signal observed on the chart is the volume, which is clearly decreasing. This may be one of the first suggestions of an impending correction. However, it is worth remembering that in such a short period of time as this, it may be a mistaken signal. We have observed similar phenomena many times. They manifested themselves in periods of upward accumulation, which often ended in further upward breakouts.
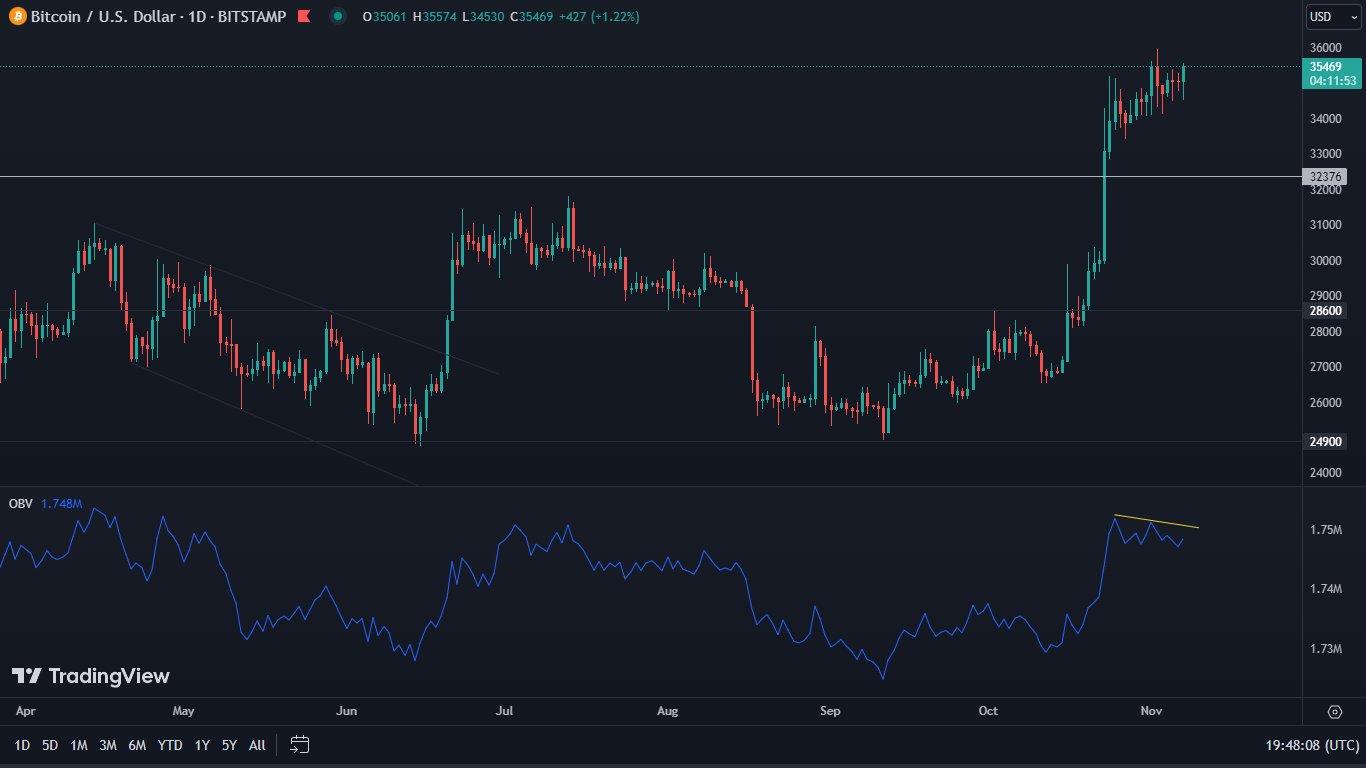
Bitcoin on a daily chart
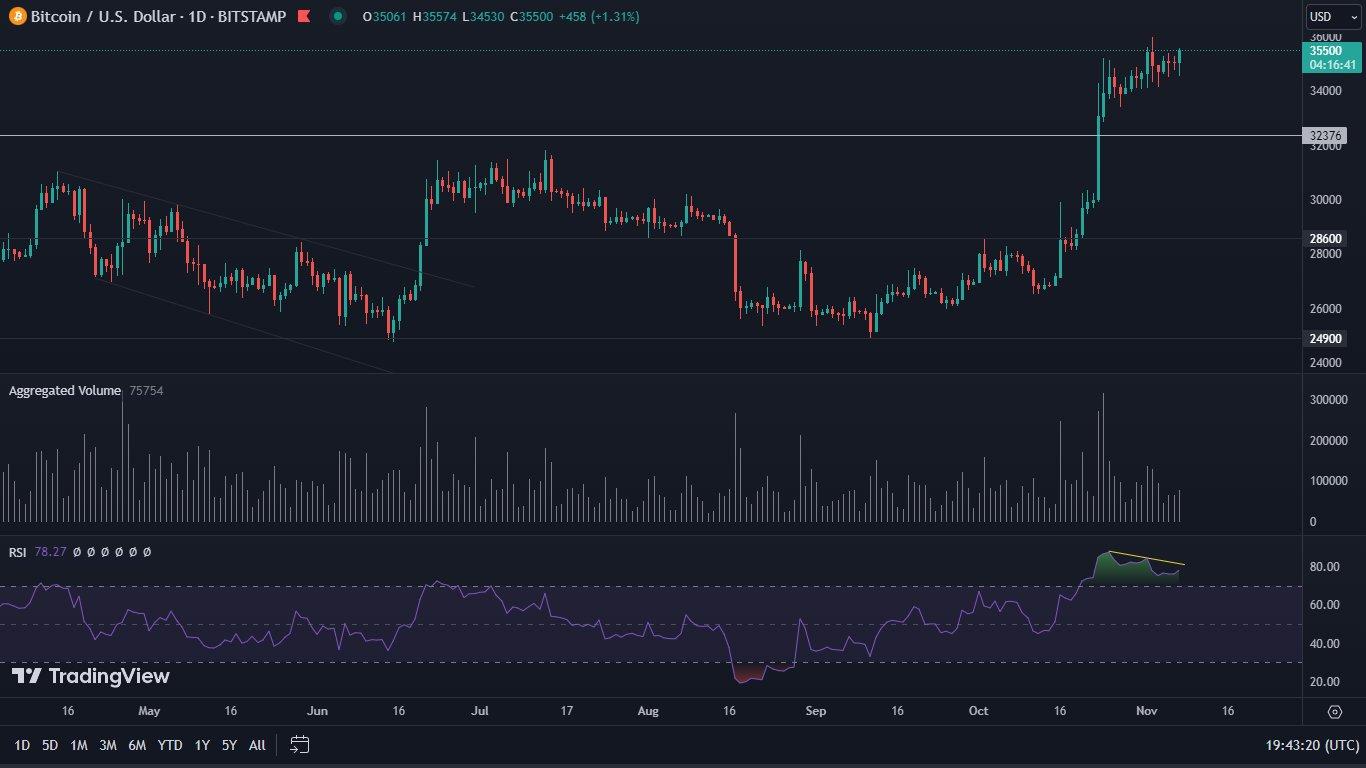
While the charts presented above look very bullish, the signals sent by the daily interval are quite different. There are many indications that a time of increased volatility is coming, which, moreover, may manifest itself in a correction of the Bitcoin price.
Here we can observe an upward channel forming. The interpretation of its structure in itself may be ambiguous. This is because we know that such formations are, as a rule, bearish formations. However, when they occur in a strong uptrend, they tend to reflect the so-called “upward accumulation”, which is ultimately a harbinger of further upward movements. To learn more about it, it is necessary to look at the indicators.
And it is here that a whole series of warning signals appear. The first of these is volume, which is clearly weakening. Let’s remember that we already see a similar situation on the weekly chart. The lower time interval, representing similar behavior, becomes, as it were, a confirmation of the earlier observations. In addition, a clear bearish RSI divergence is also taking shape.
ADX has reached 78 (very high) and is beginning to weaken. MACD, on the other hand, is experiencing a bearish cross.
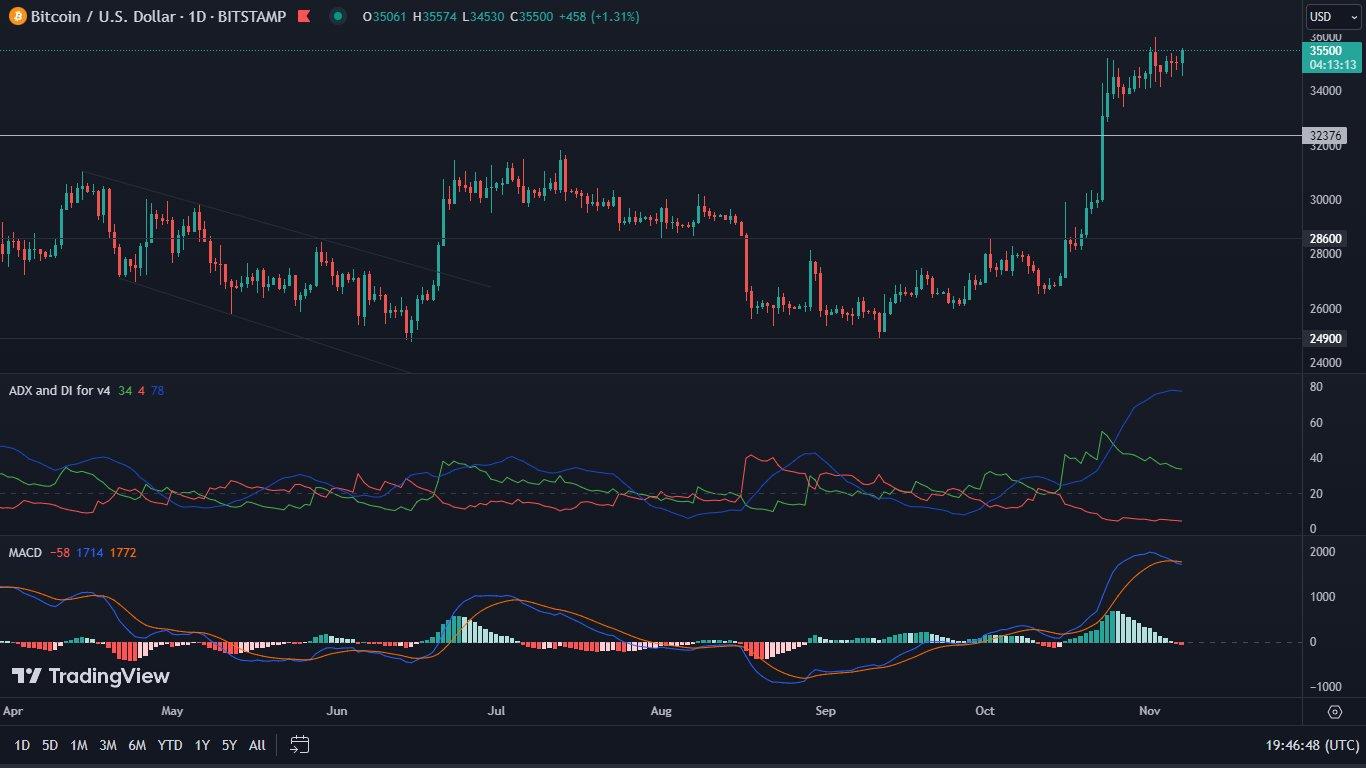
Finally, it is also worth looking at the OBV indicator, which is also experiencing a bearish divergence.
Unfortunately, it is difficult to find any bullish indicators here. Thus, if the market is not haunted by any positive event, a correction, and a possible test of the $32,300 level as support, becomes increasingly likely.