The behavior of the Bitcoin price heralds the next move. Let’s answer the question of what to expect from the price action of the king of cryptocurrencies and whether BTC is already in an area where a reversal of the ongoing trend will occur.
Two key formations
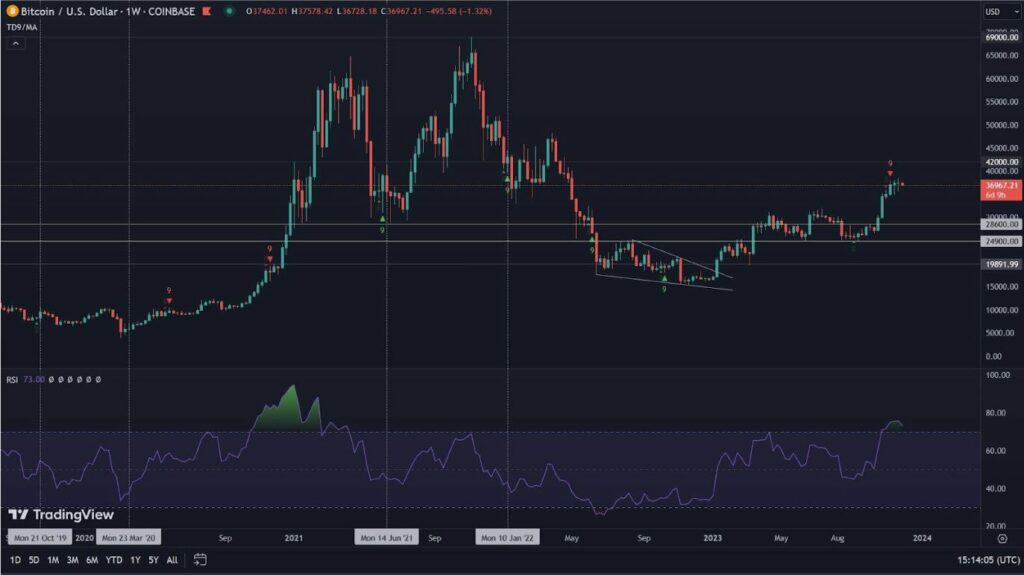
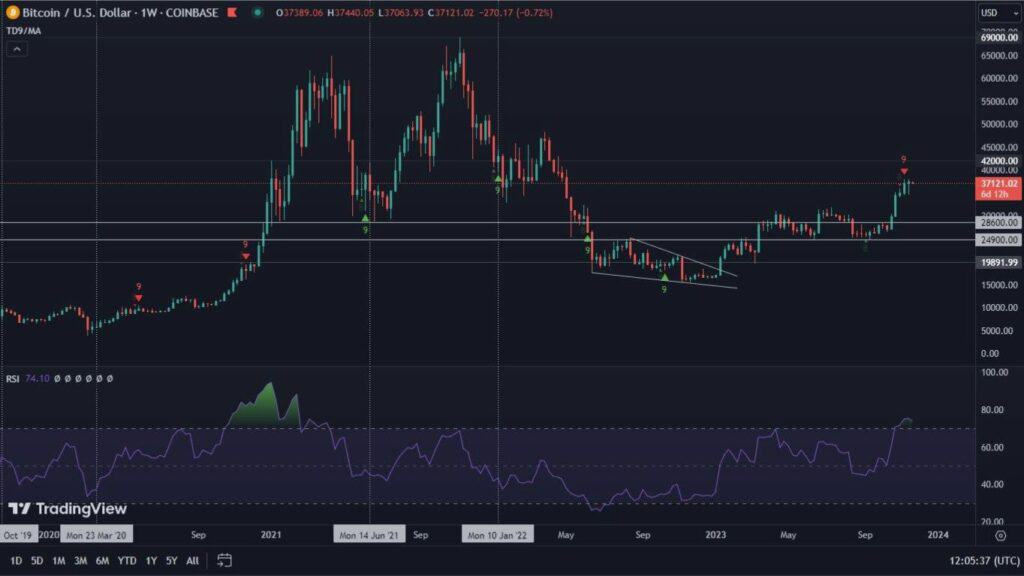
The Bitcoin price chart is taking on a very interesting structure. We can observe two, independent formations on it. The first, which is a macro object, is a descending pennant, already forming since the day Bitcoin established its ATH (November 10, 2021). The second formation, on the other hand, is a symmetrical triangle, which is successively narrowing the scope of its movement. It is the presence of the triangle that suggests to us there may be significant movements.
Many analysts suggest that Bitcoin has already reached the bottom of its valuation. It is worth remembering, however, that the triangle formation is not a signal for a potential reversal of the trend, but rather for its continuation. It is further reinforced by the bearish RSI divergence. Although it is not in the overbought zone, it has the right to have enough strength to push Bitcoin downward. The area of local overboughtness, in turn, begins to reach the stochastic RSI, which can also become a negative signal for the price.
Under such circumstances, when predicting the range of price movement, it is important to pay attention to the pennant formation. Its lower limit, at the time of writing this analysis, is at the level of $15,650, and it is falling by nearly $100 with each passing day. It is in this area that a rebound is likely to occur. On the other hand, a possible upward move would be a potential attack on the 200-week moving average (blue line), which is currently settling around $22,600.

The dollar index (DXY) sets new peaks
When analyzing Bitcoin’s situation, it is important to pay attention to the behavior of traditional markets, as well as the condition of the US dollar. With the former, BTC shows a close correlation, while in relation to the latter it behaves in opposite ways. While Bitcoin is currently occupying fairly low price levels, the DXY is breaking out of areas not seen since late 2002. Meanwhile, a very clear bearish divergence appears on the weekly chart. It suggests that the dollar’s buying power is beginning to weaken, making it likely that the index will decline in the near term. This is a very positive signal for Bitcoin, possibly triggering short-term increases.

Cryptocurrency market capitalization defends an important area
Looking at the chart of the capitalization of the entire cryptocurrency market, we can see that the historically important level of $800 billion, is still met. At the same time, on the weekly interval, we see a significant overshoot of the TD Sequential indicator, as well as a turning histogram of the MACD indicator. This is quite significant, and a bullish signal for the market. A possible continuation of declines could lead to support in the $600 billion area. Increases, on the other hand, should represent an attack on 1 trillion.

The condition of the U.S. economy an indicator of movement
It seems that the charts are currently sending mixed signals. Maintaining such a situation for an extended period of time is, paradoxically, a good sign. Market indecision, while capitulating to many of its participants, has often resulted in reaching a bottom and changing the direction of the prevailing trend. At the same time, it is worth watching the condition of the global economy, with particular attention to the situation in the United States. Potential easing of monetary policy, or possible signals of an impending recession, can have a major impact on the valuation of the cryptocurrency market.