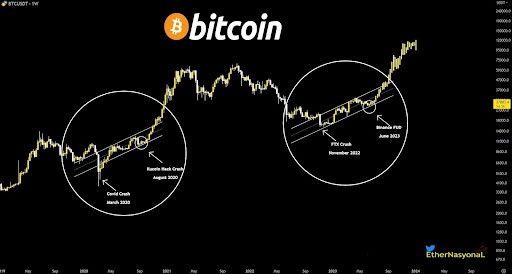
Bitcoin has somewhat slowed down its volatility after recent dynamic moves. Nevertheless, it has again found itself below a key support, and it is consolidating under it. This is not a good sign, but it is not the only one that fills one with concern.
Bitcoin on the weekly chart
More and more often in our analyses we cite the weekly perspective of Bitcoin’s valuation. It is on it that historically we could find important signals, suggesting further price movement. This time is no different.
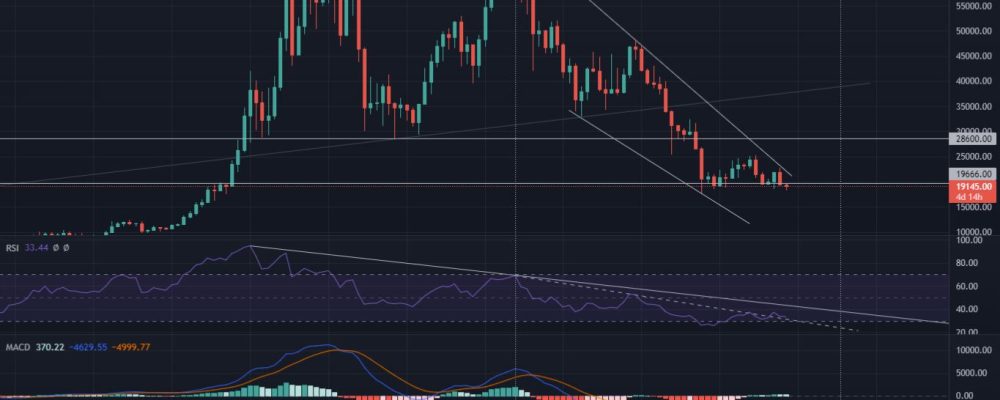
It is important to pay attention to the area marking the 2017 peak. This space is considered a key support, which has been increasingly violated recently. The weekly chart thus shows numerous wicks swinging below the mentioned level. Of additional concern is the fact that the past week even ended with the closing of a candle below this area. Importantly, this happened for the third time in the last 3 months.
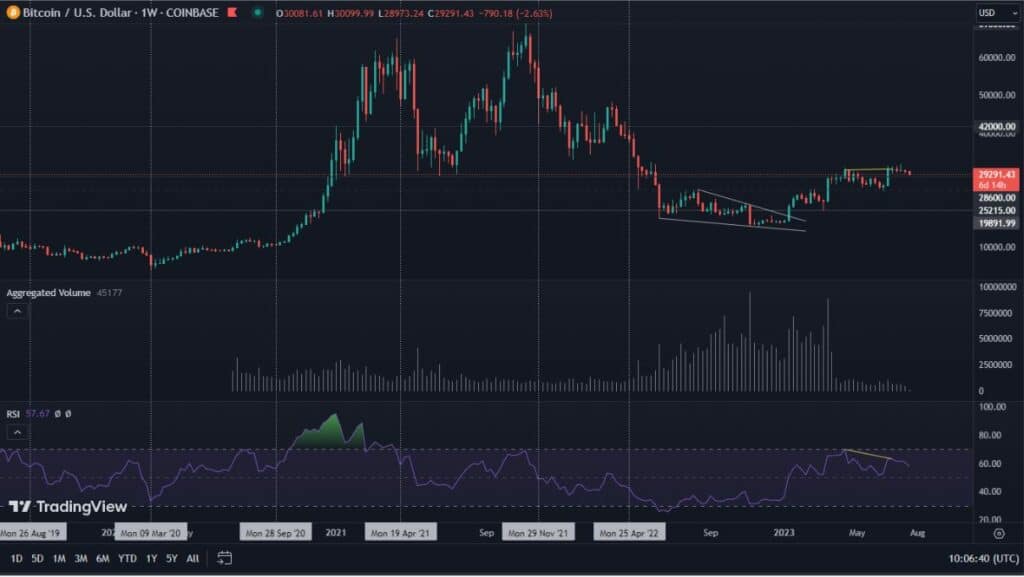
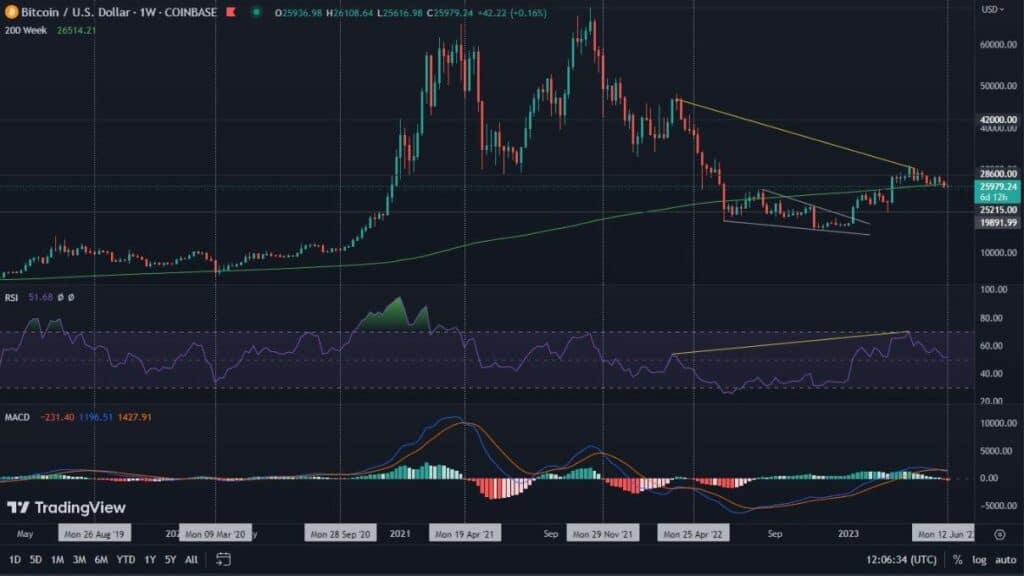
It is also worth noting that Bitcoin has increasingly continued to consolidate below $20,000. A psychological area of similar importance was the $30,000 region. While last year, the upward breakout from it was derived from the accumulation above this psychological barrier, this year, the declines have gained momentum, after consolidation just below $30,000. Thus, there is a reasonable assumption that the area of the 2017 peak and the consolidation below, significantly support a bearish outlook.
Meanwhile, the RSI is attempting to test the dashed line as support, and the MACD is still holding a rather weak, but nonetheless bullish momentum.
Bitcoin on the daily chart
The daily chart also confirms the above observations. On it we see a clear consolidation that has been going on since June, which is further transforming into a head and shoulders pattern. The volume clearly supports this pattern. Thus, a very high risk of a continuation of declines appears. If such a scenario occurs, it is expected that the BTC price will start searching for a new this year’s minimum.
Traditional financial markets with a strong directional bias
An element of analysis that absolutely must not be lost sight of at the moment are the traditional financial markets. It is worth paying particular attention to the US SPX index. This one, in turn, hints at some interesting information, and only through two weekly candles.
Thus, we see a clear downward trend and two consecutive so-called engulfing candles. The first, the green one, which marked a change in sentiment from negative, to positive, and the red one that followed, which also reflected a sharp change in market sentiment. The fact that negative sentiment hit with such force just after everything pointed to a cooling of the market adds to the uncertainty. It has the right to result in further declines. Here, too, an attack on this year’s minima seems highly likely.
The dollar is not slowing down
In the face of ever-rising interest rates and weakening economic momentum, the dollar index is recording new, long-unseen peaks. The DXY chart shows a clear bearish RSI divergence. However, it is difficult to talk about its effective playing out, given the current global conditions. At the same time, the MACD is at the threshold of another bullish intersection, which has the right to indicate further upward movement. This kind of outlook is a negative signal for the cryptocurrency market.


