Just one week was enough for the leading cryptocurrency to rise 22.0%. BTC thus negated a number of signs that spoke of declines. Meanwhile, the Hash Ribbons ‘Buy Signal’ flashed, suggesting the end of the miners’ capitulation. Historically, it is almost infallible and signifies a continuation of the long-term rally.
Bitcoin on the weekly chart
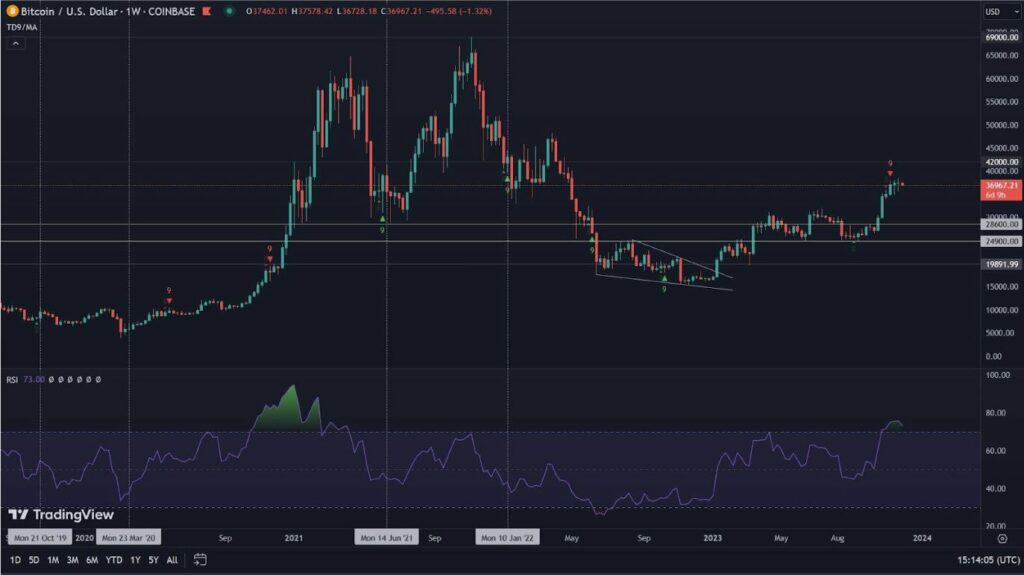
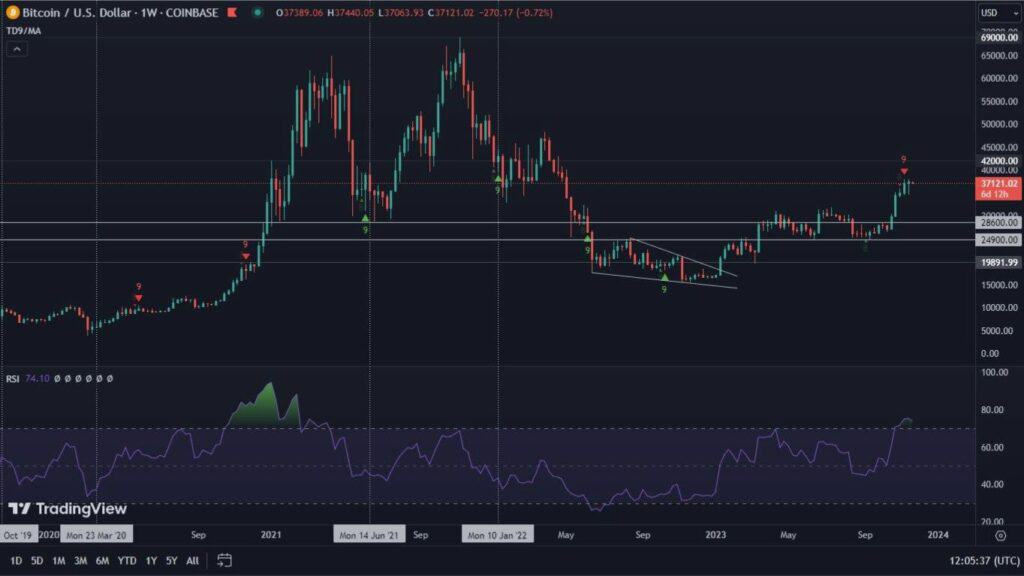
We traditionally begin our analysis by presenting Bitcoin’s situation on the weekly chart. The first and obvious thing that strikes the eye is the high green candle, indicating a 22.0% increase in the value of BTC. At the same time, the descending wedge formation was defeated. There were also two much more interesting signals. The first is the RSI, which, holding above the downward trend line for the second week in a row, confirmed its breakout. Recall that the value of the indicator, under resistance, has been for the last 103 weeks. Over the past 3 months, numerous, but unsuccessful attempts to overcome it were evident. This time success was achieved.
Equally important is the Hash Ribbons buying signal, whose accuracy in predicting further price rallies, is almost perfect. About its impact on the price, we will tell in much more detail in the next part of the analysis. In the meantime, it is worth noting that the breakout point turned out to be the 350-week moving average (green line), the essence of which we have often emphasized recently. Let’s note, however, that on the RSI indicator, the first bearish divergence appeared (yellow line). It may have implications for a possible deceleration of price action or even a correction.

Bitcoin on the daily chart
In the case of the daily chart, we are tempted to draw out potential scenarios. But before we get to them, let’s talk about the facts that have occurred.
In this case, even more clearly than on the weekly chart, we see the breakout from the falling wedge formation. In addition, the resistance zone, marked with a gray rectangle, was overcome. Since the increases also included the weekend, a significant CME gap was formed, the extent of which covered as much as 7.3% of the increase (yellow rectangle). It becomes the key for further price action. At the same time, looking to the left, we see a local peak, set exactly where the current value of BTC is. This represents significant resistance. With the green line, meanwhile, we marked the 200-day moving average, which has usually provided resistance for Bitcoin, or in other cases support.

Analyzing these factors, we put forward the thesis that the price of BTC may at this point seek to form a descending channel (yellow lines). The cryptocurrency market is characterized by a penchant for parallel formations. This one, in addition, would satisfy both bulls and bears. For bulls, it would be a formation suggesting a breakout. Bears, on the other hand, wanting to confirm it, would see a chance to form a new bottom. Hence, it is worth watching the behavior of the price around the CME gap. If it is not filled or its filling is only partial, the pro-growth scenario, remains highly probable.
Keep in mind, however, that the market is short-term oversold. This is illustrated by the RSI divergence, the Stochastic RSI indicator, as well as the TD Sequential.

Hash Ribbons ‘Buy Signal’ and its strength
What constitutes one of the most bullish signals on the chart is, of course, the Hash Ribbons buying indicator. On the one-day interval it has appeared for the fourteenth time in its history. Thirteen times it has suggested a rally. How will it do now? We take a look at its historical performance:
December 2011: +76% in 15 days,
June 2012: +156% in 58 days,
February 2013: +1195% in 61 days,
January 2015: +13% in 43 days,
May. 2015: +40% in 66 days,
August 2016: +96% in 127 days (and about +4500% in 469 days),
January 2019: +250% in 167 days,
December 2019: +46% in 47 days,
April 2020: +41% in 38 days,
July 2020: +35% in 36 days,
December 2020: +250% in 133 days,
August 2021: +61% in 95 days,
August 2022: -25.6% in 94 days (signal only on the daily chart).
So the last of the Hash Ribbons buying signals was not confirmed on the weekly chart, with the result that it did not work. This time, as we know, is quite different.