Bitcoin is falling again, thus rejecting the resistance zone located around $30,000. This is the state of affairs we predicted in the analysis we compiled a few days ago. The question, however, is what we can expect from here. Leading crypto market analysts present different views.
Material Indicators is watching key levels again
As we did a week ago, we begin our review of opinions this time by looking at the data that @MI_Algos presents on his Twitter profile. Using FireCharts, this popular analyst shares information on potential resistance and support levels. On Friday, April 21, he made the following observations while reviewing market data:
~$150M+ in #Bitcoin bid liquidity laddered down to $25k. It's good to see some depth, but also need to see some density closer to the active trading range.
— Material Indicators (@MI_Algos) April 21, 2023
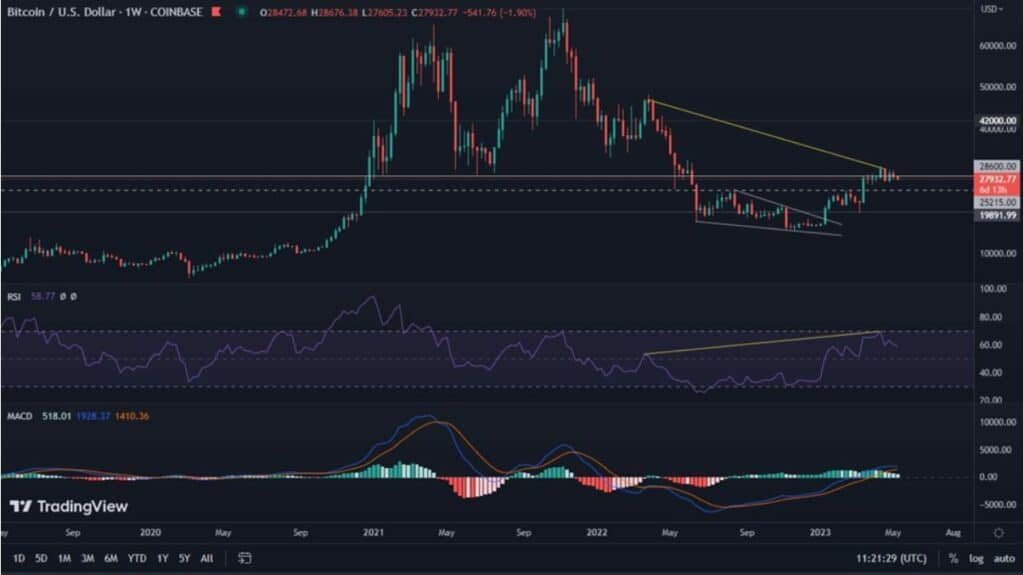
If bulls can't reclaim $29k, bears are going to push for a retest of the 200-Week Moving Average.
Will continue to watch… pic.twitter.com/im5FnHa633

“The ~$150 million+ of liquidity in Bitcoin has moved into the $25k area. It is good to see some depth, but also density closer to the active trading range.
If the bulls fail to regain $29,000, the bears will push for a retest of the 200-week moving average.
I will continue to watch FireCharts to see how order book liquidity develops for clues. The side with the most depth and density usually wins.”
Seth sees a real chance of a rebound near 25k
An analyst known as @seth_fin watching the chart believes that the price of Bitcoin will go down to the $25,000 level. He outlines a number of reasons for this. As we read in his Twitter post:
#Bitcoin
— Seth (@seth_fin) April 21, 2023
Same plan as I gave you since 3 weeks ago! 📉🩸🩸📈
30k📉25k📈🔥🚀
-These are the support levels.
-Daily RSI needs to cooldown.
-Retail Longs needs to be flushed out before a move up!
-There is also a GAP at 20k to watch out for!$BTC.X#Crypto
NOT FINANCIAL ADVICE pic.twitter.com/lnjCshkXNl

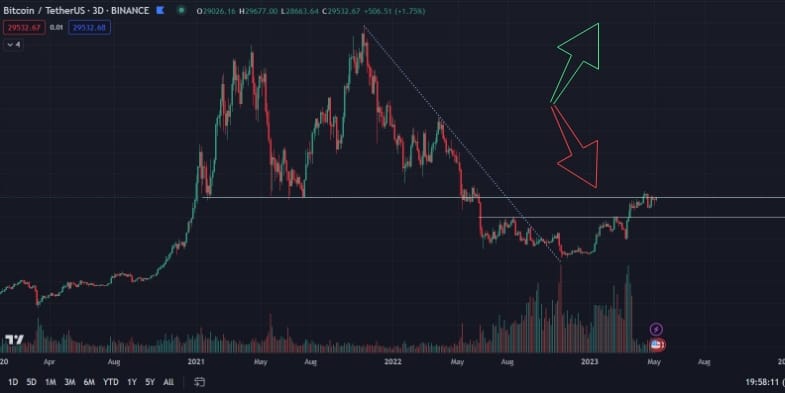
“The same plan I’ve been giving you for 3 weeks! 30k, then down to 25k and up again.
– These are the support levels.
– Daily RSI needs to cool down.
– Long positions need to be flushed out before the move up!
– There is also a GAP at 20,000 to watch out for!”
Crow more bullish
On the other hand, the analyst known as @TheCrowtrades expects Bitcoin to react positively at higher price levels. As he reports:
$BTC
— CROW (@TheCrowtrades) April 21, 2023
On higher time-frames, $27,500 is the area I'm expecting to see a good reaction and relief from. probably will take out liquidity around it and start taking those stops built above!#Bitcoin pic.twitter.com/ZJtgK19p3N

“On the higher timeframes, $27,500 is an area where I expect a good reaction and relief. There will likely be a pullback in liquidity around it and there will be a collection of ‘stops’ built above!”
Evca Wolf set for chart repeatability
At the very end we present the female point of view. Unfortunately, they are much rarer in the analysis of Bitcoin price charts, but no less important. @evcawolfCZ marked two progressive upward channels in succession. She noted what the price reaction was after the first one broke out, and expects it to be similar this time.

Analyzing the markings on the graphic she provided, we see that she is observing two price levels. One is around $26,800 and the other, again, is $25,000.


