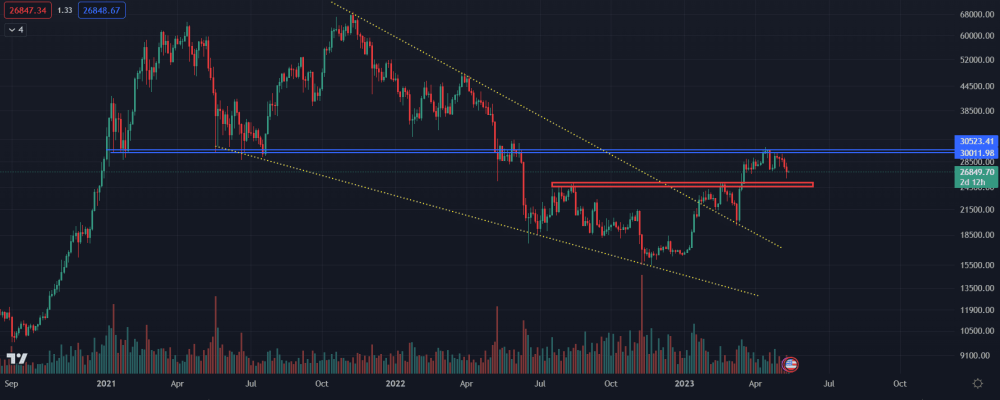
USD 26,500 is the level on which most market analysts are currently focusing their attention. At this exact moment Bitcoin is trying to hold this area and protect itself from further correction. Will it succeed? Let’s see how opinions break down among chart analysis leaders.
Trader JO sees manipulation
Back on Thursday, May 11, an analyst known as @jobtcfx, using FireCharts, posted the following graphic on Twitter.
やはりフェイク(中途半端で過去のレジサポもないな値位置で胡散臭かった)でした…25.4kに移動#BTC https://t.co/sGHydikwfN pic.twitter.com/DbckWuwuGc
— Trader JO (@jobtcfx) May 11, 2023

The data shared in it from @MI_Algos clearly shows that the support at $25,700 has completely disappeared. It has decreased in value and moved to the level of $25,400. From the words of Trader JO, one can infer that it was artificial and intended to create the impression of local demand.
Nevertheless, the very next day, the analyst admitted that although declines are possible, “still in the category of price range correction, the overall upward trend has not yet broken down.”
It’s hard not to admit he was right in such a situation!
Cryptollica sets key supports
@Cryptollica is an analyst who specializes in evaluating price action on long time intervals. Thus, he perfectly catches areas where Bitcoin is overvalued as well as undervalued.
This time he also reached out to the one-day chart, posting the following on Twitter:
#btc BTC/USD 1W & 1D shortterm analysis $btc
— Cryptollica⚡️ (@Cryptollica) May 12, 2023
>I always say Im on positive side for the long term (monthly)
>When we examine on a weekly and daily; I except, spend a few (week) time here. My supports are ~25400$ and Ema200 (~24500$).
>Also look 1D rsi; not much space to fall… pic.twitter.com/yL3vN2f88I

He points out the support at around $25,400, as well as the EMA200, which is present slightly lower. This one, in turn, is oscillating around $24,500 and could be critical support. However, as @Cryptollica mentions, according to the RSI, there is little room left for declines.
According to CryptoBullet, fate can sometimes be ironic
The analyst known as @CryptoBullet1 notes an interesting correlation between this year’s chart and the events of 2021. As he points out, Bitcoin’s local peak was set on the same day as two years ago, and the chart structure remains remarkably similar.
Ironically, #Bitcoin topped out on the same day it did in 2021 – April 14th 😂
— CryptoBullet (@CryptoBullet1) May 12, 2023
Structures are also somewhat similar pic.twitter.com/gInm2CS3tu

The comparison is loose in nature, and therefore should not necessarily be given any particular significance. It also seems unlikely that the declines as deep as those recorded at the time. Nevertheless, the observed phenomenon is particularly interesting.
Nico takes a look at the UCTS signals
For the analyst known as @CryptoNTez, the key support was the $27,000 level. Its loss opened the way for declines, even to levels near $24,000. In his analysis, he writes that the UCTS signal once again did an excellent job of indicating the level at which to consider opening a short position.
#BTC
— Nico (@CryptoNTez) May 12, 2023
Losing 27k and leaving the 27-30k range where it has been stuck since March
Unless there is a deviation and we immediately reclaim the range with strength, I will be looking lower
probably in the 24k range
UCTS Sell signal on chart as trigger of the short trade pic.twitter.com/wmGdtAcyQ6

Meanwhile, we also encourage you to read our author’s analysis, in which, based on indicators as well as a variety of time intervals, we discuss Bitcoin’s current price action. You can find it here:


