Bitcoin’s price is falling, losing contact with the $30,000 level. What’s next for the leading cryptocurrency and where should we expect the next turning point?
Bitcoin on the weekly chart
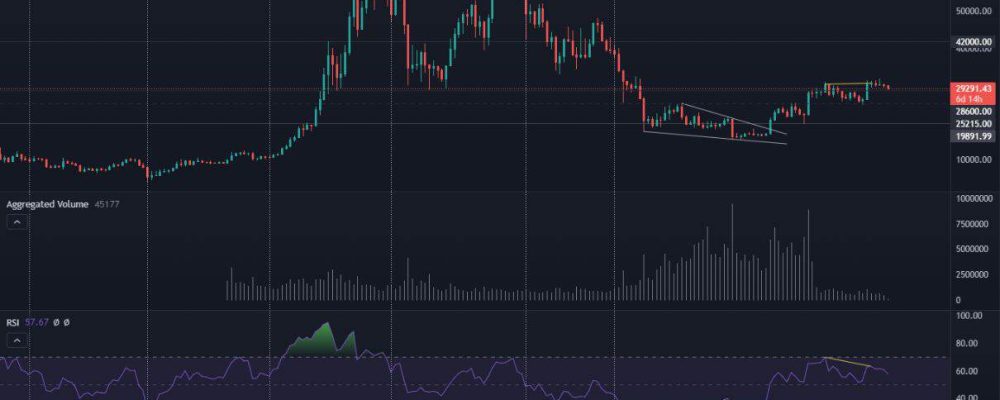
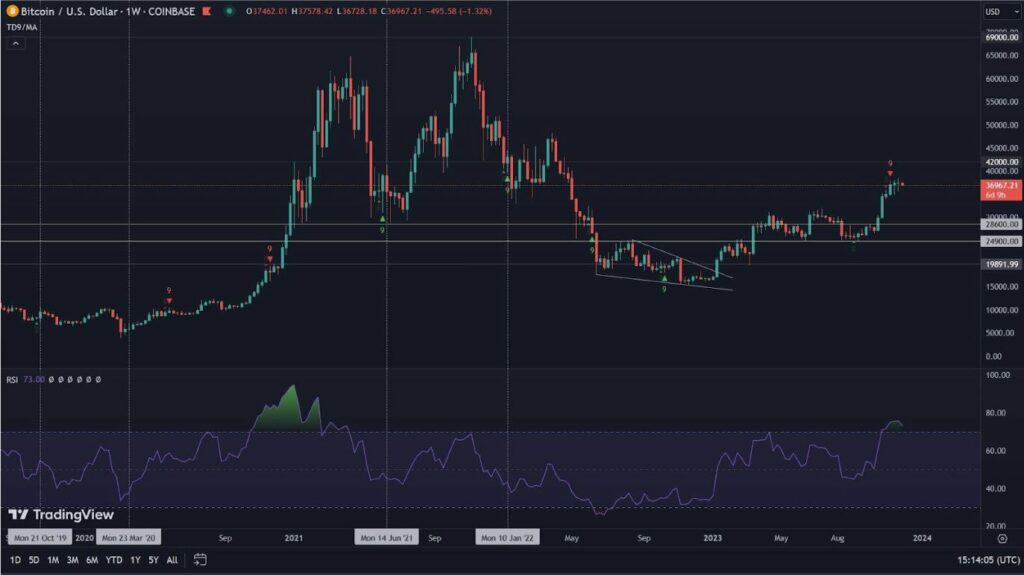
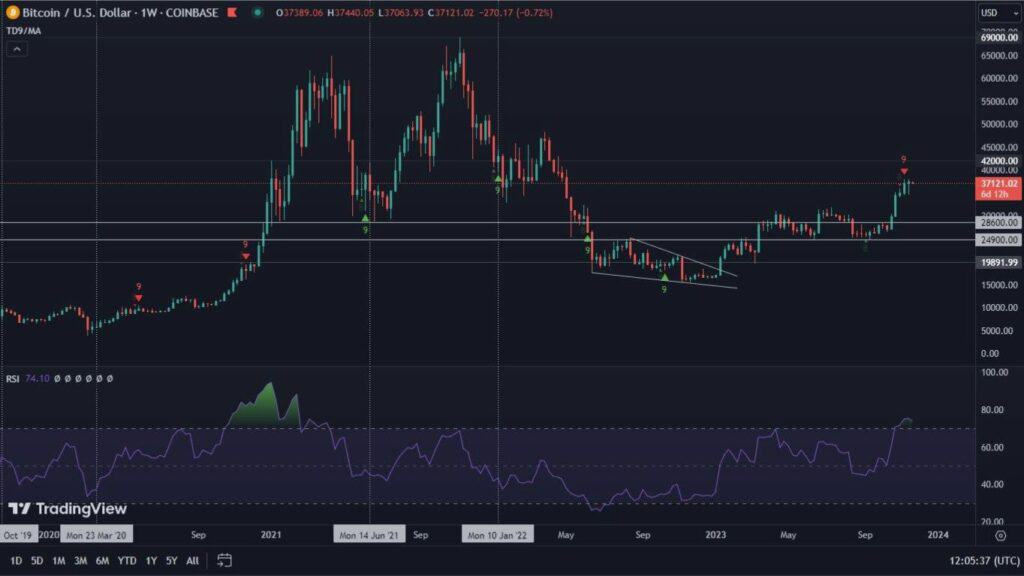
We begin, of course, by presenting the situation on Bitcoin’s weekly chart. Here, unfortunately, not much is happening. There have been relatively cosmetic changes since our last analysis, which have not particularly affected the volatility of the BTC price. As a result, we are witnessing a 0.55% decline in the value of the leading cryptocurrency. This keeps Bitcoin in a consolidation zone that has been in place for many weeks. We also continue to see a bearish RSI divergence, which has long signaled a potential price slide. Nevertheless, the RSI remains above the 60 level, which is assessed as a healthy area, favoring the bulls in the process.
Bitcoin on the daily chart
On the other hand, the most interesting thing we can read from the daily chart. Here we can clearly see the price of Bitcoin slipping towards support at the $28,600 level. The 100-day moving average is also located in the same region. We have marked it with a pink continuous line. The confluence of the two factors may give the price a chance for a strong rebound. In addition, the phenomenon is accompanied by a bullish RSI divergence, which is difficult to pass by.
Thus, we think that the Bitcoin price finds the potential for an upward turn. It does not necessarily have to make direct contact with the 100-day SMA, but we nevertheless see this zone as a possible lowest point for a rebound. Further action on the chart will allow us to determine whether it will be short- or long-term.
Hash Ribbons positive again
The Hash Ribbons indicator, which we wrote a lot about in our previous material, suggests that miners are once again profiting from the sale of the Bitcoin they mine. Nevertheless, we are still not witnessing the emergence of a buying signal. Moreover, as history has shown, it was effective only when simultaneously seen on both the intraday and weekly charts. For the time being, we are watching the indicator and expect it to provide us with further interesting information.
Is this the end of the altcoin season?
Meanwhile, Bitcoin’s dominance is reaching a level that we see as a key decision point for both the king of cryptocurrencies and the altcoin market.
We have been watching the 50% level for a very long time, as well as the 100-day moving average itself. Bitcoin has been oscillating with its capitalization around half the value of the entire market for almost two weeks now. Now, however, the aforementioned SMA is steadily approaching to make contact with the same level. This could mean a rebound and Bitcoin proving its worth once again.
In the meantime, we have seen significant increases in the value of selected smaller coins. At the forefront, of course, were the large marketcaps, with XRP, Solana (SOL), Bitcoin Cash (BCH), Stellar (XLM) and Chainlink (LINK) in the lead. At the same time, we expected that the altcoin season might be short-lived. Has it therefore been completed?
In our opinion, not necessarily. After Ripple’s recent resounding victory over the SEC and the aforementioned increases, a time of uncertainty has come, and the market is holding its breath waiting for a sign indicating where it will be better for it to place capital. The maintenance or not of the 100-day SMA will probably be a very good signal for this. We therefore recommend watching.

