The beginning of a new week brings sensational events. Bitcoin is up 10.2% in just one day. There are, of course, solid reasons for this. Let’s take a look at the charts and see how the chances of a continuation of this spectacular movement look.
Bitcoin on the weekly chart
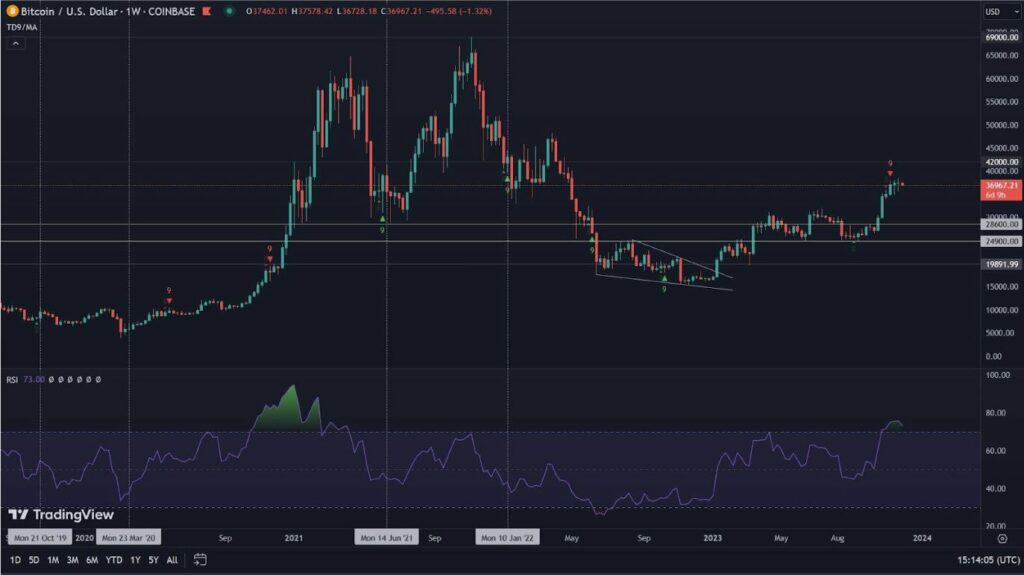
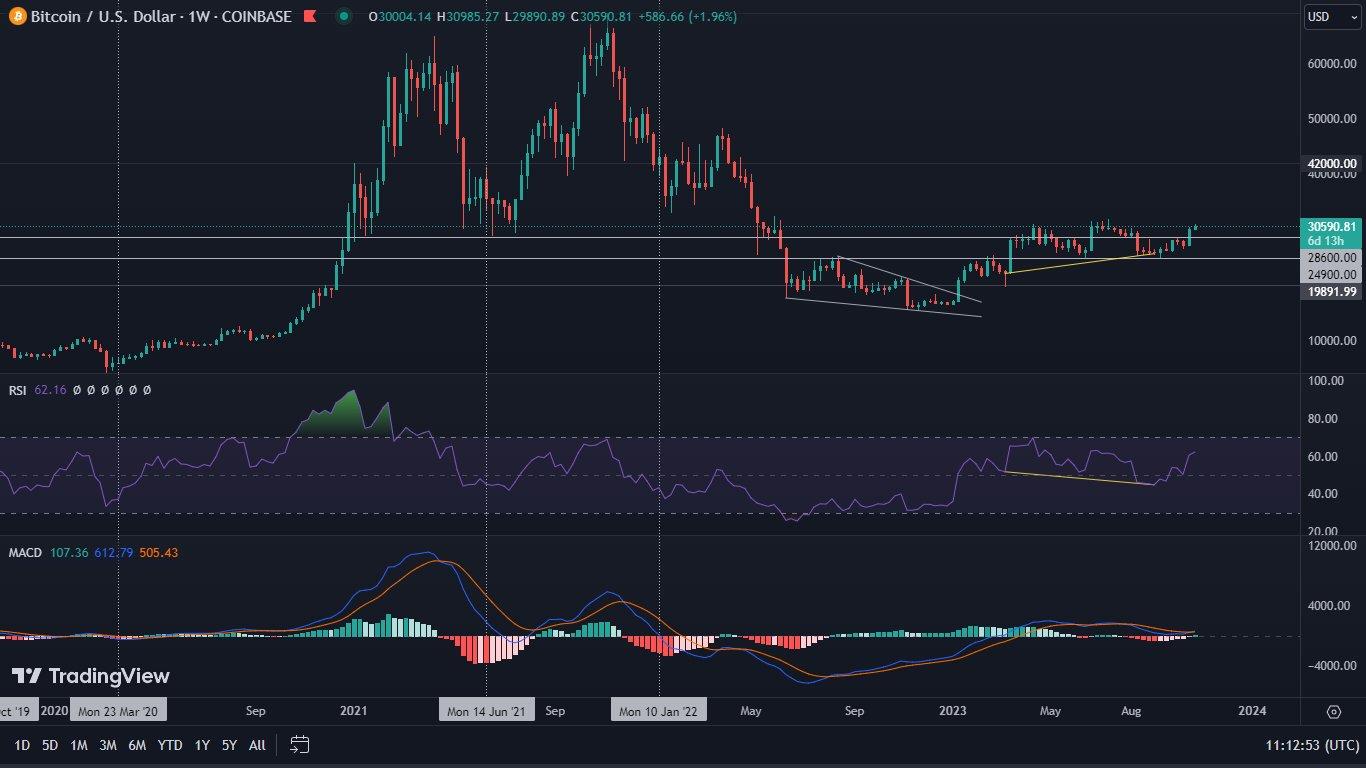
We traditionally begin our analysis by looking at Bitcoin’s situation on the weekly chart. It is worth noting that it does not include the breakout mentioned in the introduction, but nevertheless it gives a number of positive signals that suggested such a move.
Thus, Bitcoin has risen by 10.4% in the past week alone. RSI bounced off the important level of 50 and jumped above the level of 60. Thus, the bulls absolutely dominated the market. The whole thing is complemented by a bullish RSI divergence, which we have been observing for quite some time. A bullish MACD cross is also visible on the chart.
Already at this stage, Bitcoin has managed to break through a number of important resistances. One of them is the 100-week moving average (yellow line). Another, however, is the 200-week moving average (green line). The horizontal barrier has also been broken. We are talking about the level of $28,600, which has been a very serious problem for the bulls for a long time.
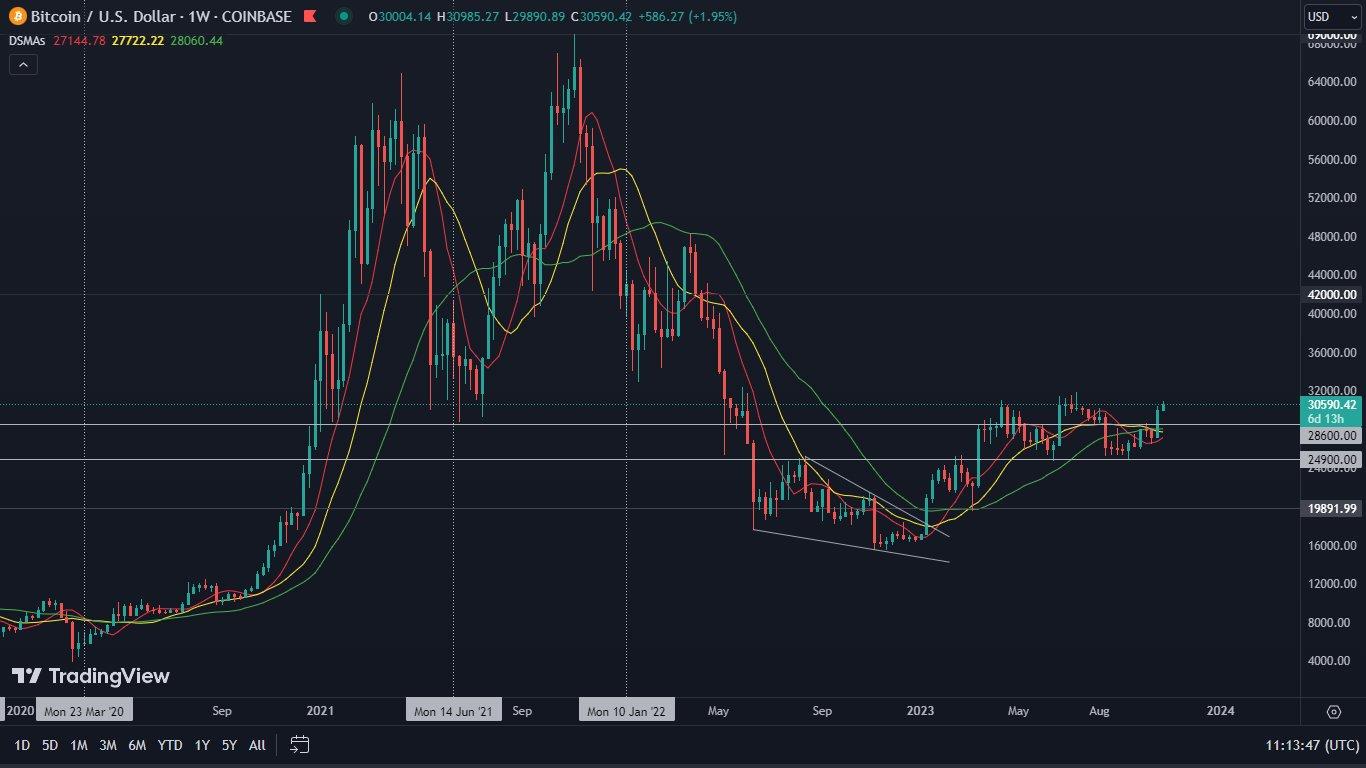
Based on this data, through the prism of the weekly interval, new support should be sought precisely in the area of $28,600. Resistance, on the other hand, in the area of $31,800 – $32,000. As it turns out, however, the daily chart may completely contradict such a construction of events.
Bitcoin on the daily chart
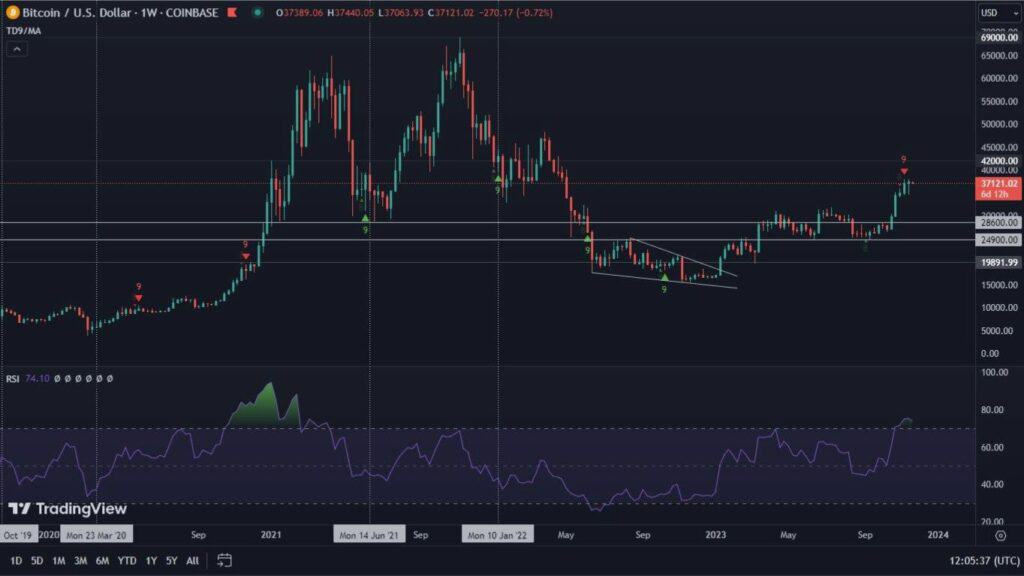
Monday, Oct. 23, was the day when the green went into full force on the Bitcoin chart. The daily breakout of the leading cryptocurrency was 10.2%. At its peak, it even reached a level of 14.5%, which caused the value of BTC to momentarily exceed $35,000. We wrote about the reasons for these events, as well as the subsequent gentle retreat of the price in a separate material. If you haven’t read it yet, be sure to take a look: “Bitcoin soars, the aftermath of new ETF news”.
However, focusing solely on the analysis, we can see that Bitcoin has reached a level that has the right to be resistance. This is because these are the price bottoms of summer 2021, and January-February 2022. In addition, we can note that the recent candles open outside the Bollinger Bands area. Such a scenario usually (but not always) suggests that the rally should cool down. Consolidation, or a correction, is therefore advisable.
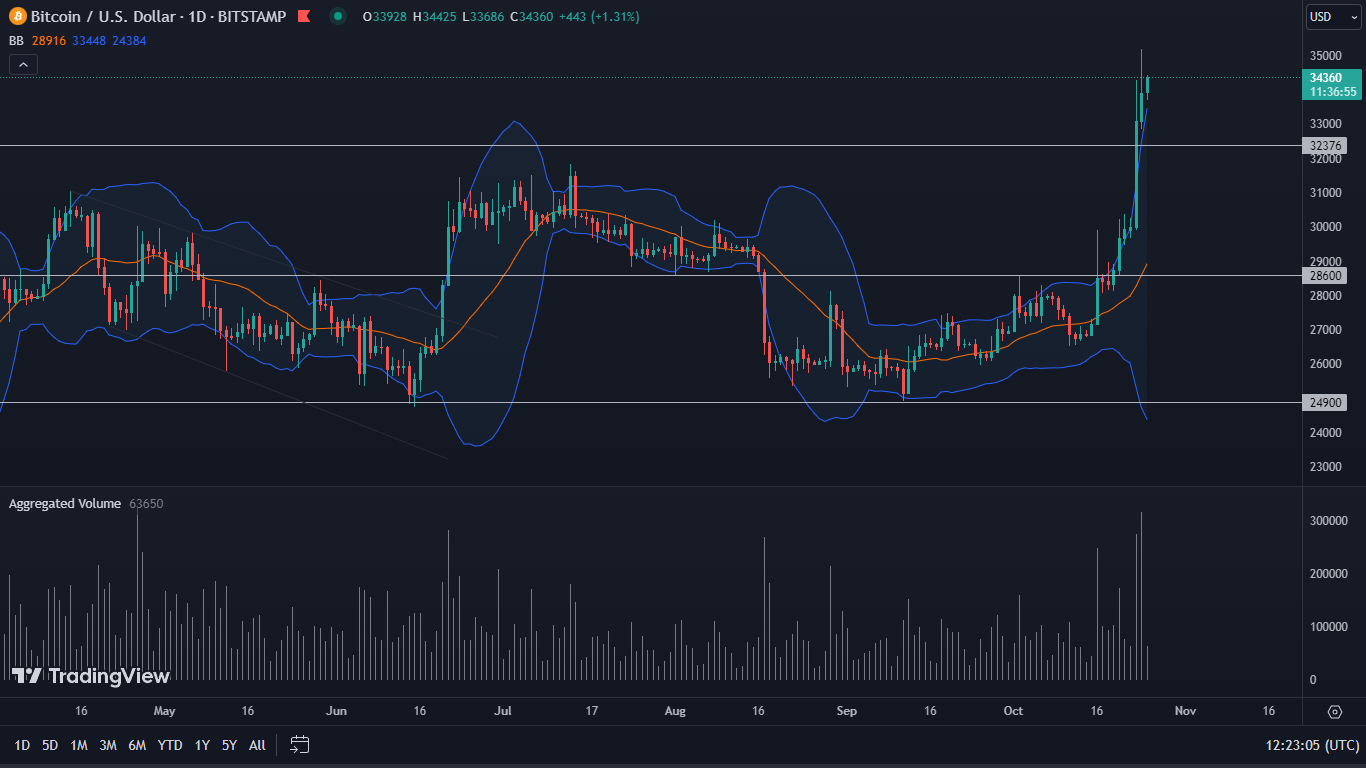
The breakout, however, is supported by very strong volume. Therefore, its continuation remains highly probable. Nevertheless, if there is a correction, we expect a strong buying reaction in the area of $32,300.
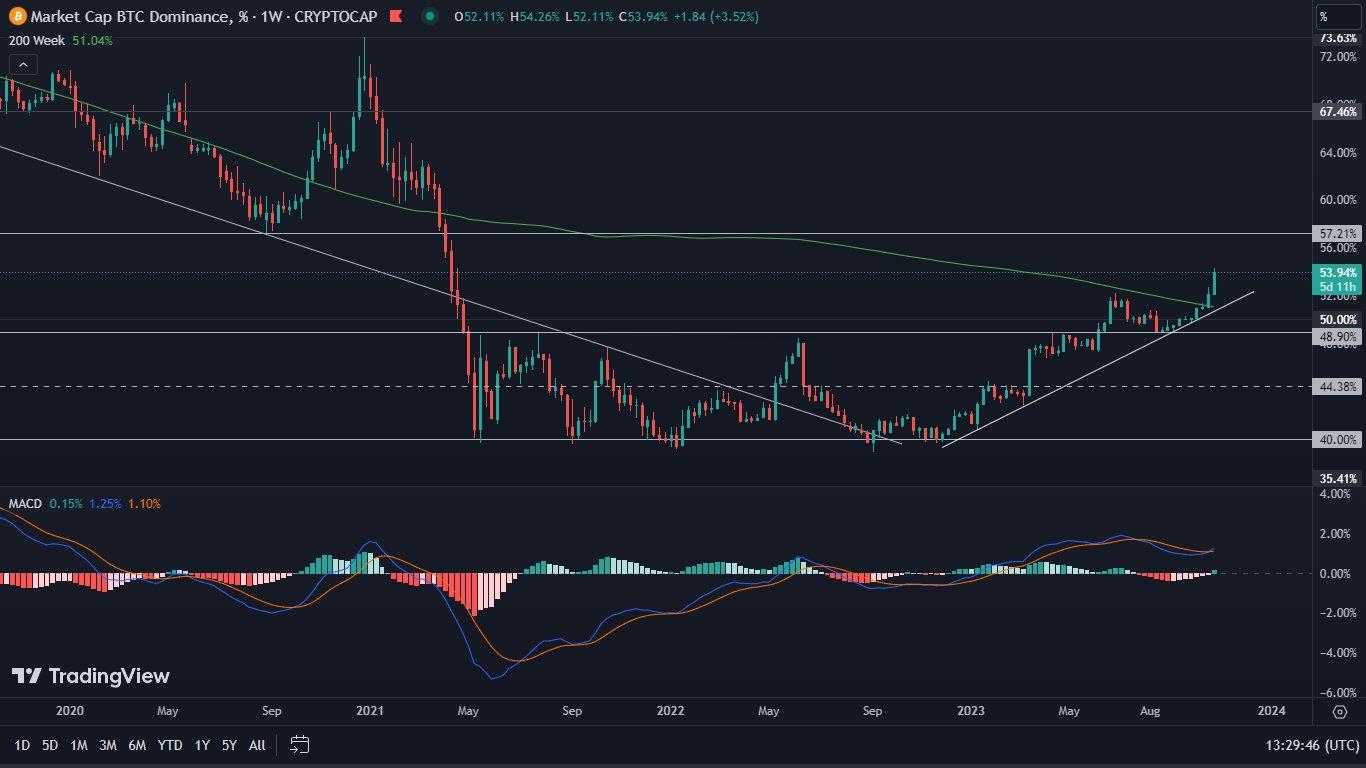
Bitcoin’s dominance leaves no illusions – the trend is strong
The chart of Bitcoin’s dominance looks extremely interesting at the moment. The leading cryptocurrency totally dominates the rest of the market. The 200-week SMA has been decisively broken, and this movement is accompanied by a bullish MACD cross. Despite the fact that in the current situation BTC is in a resistance zone, it is highly likely that increasing dominance over altcoins will continue. The level to watch is 57.2%. This is where we expect a reaction from the smaller coins.