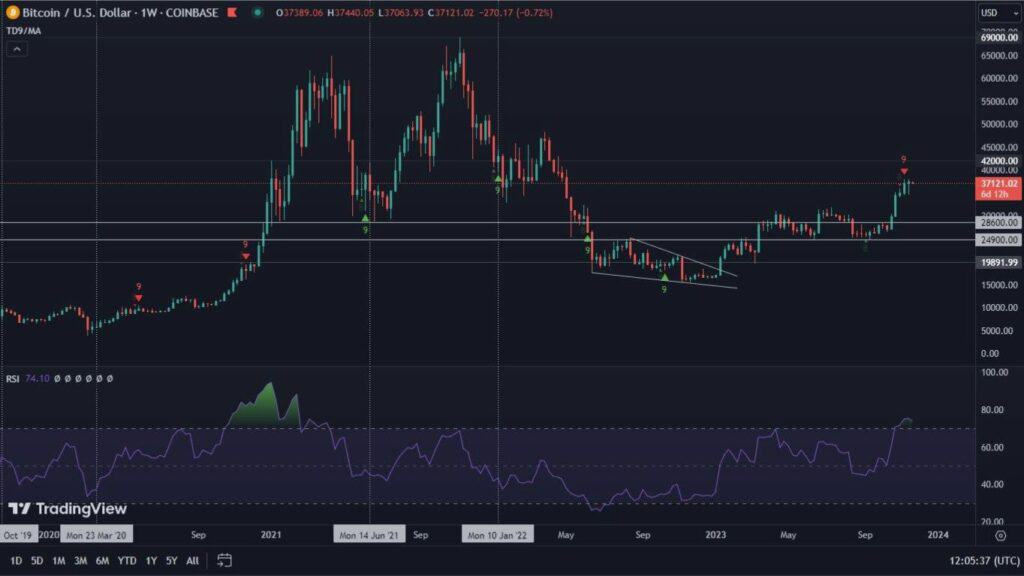
Once again, bitcoin is behaving as expected, thus reaching the level of the 50-day moving average. This area has historically often provided resistance. Will it be similar this time, however, or is a strong upward breakout expected?
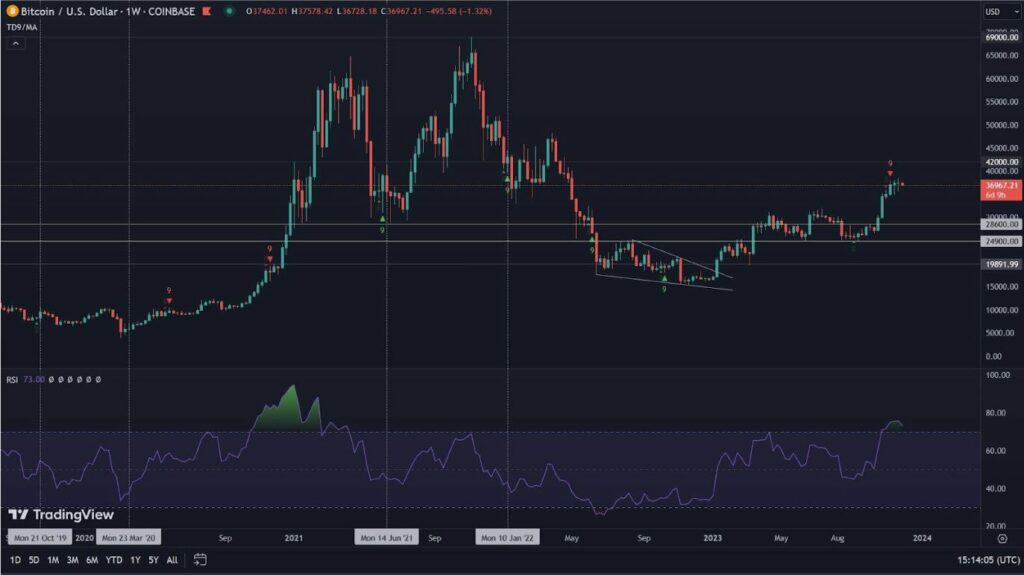
Bitcoin on the weekly chart
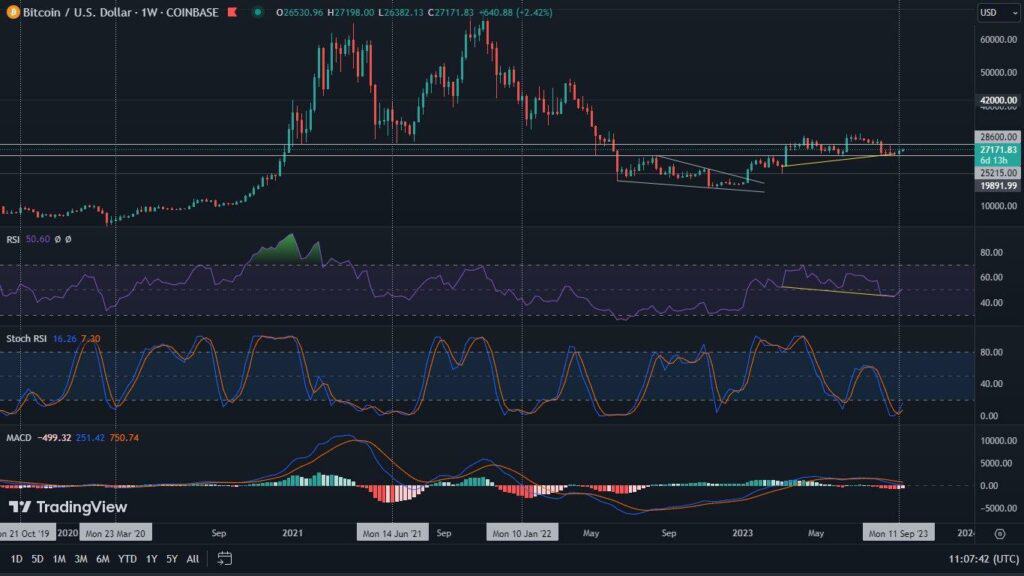
Although September is considered bloody in the cryptocurrency market, Bitcoin does not seem to have manifested this for the time being. As a result, the leading coin is recording increases. In the past week they amounted to 2.7%. Thus, a new horizontal support level of $24,900 was confirmed. A bullish RSI divergence certainly contributed to these increases. The stochastic RSI bounced off the bottom it formed. MACD, on the other hand, seems to have found a new turning point. This will allow it to gain momentum and potentially push the indicator upward.
On the other hand, it may be of concern that the RSI value still remains at a relatively low level of 47. It should be remembered that the chart structure has also formed a lower bottom, which also does not give cause for optimism. However, in order to qualify as such, it is necessary to form a lower top. Confirming or denying such a scenario, on the other hand, requires a bit more time.
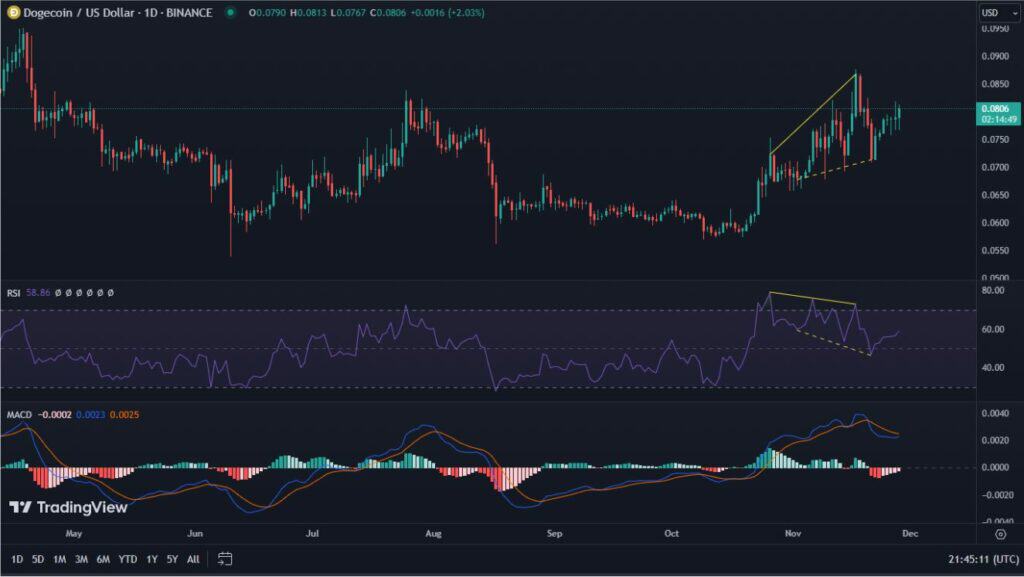
Bitcoin on a one-day chart
In accordance with our earlier forecasts, Bitcoin entered a steady upward movement after making a false breakout. This momentum was supported by the bullish RSI divergence, which we marked with a yellow dashed line on the chart. Now, however, the BTC price has reached a very important resistance, in the form of the 50-day moving average. This SMA has repeatedly provided an important bounce point for the price. In addition, at the same time the chart manifests a bearish divergence (yellow continuous line). The confluence of these factors, has the right to result in declines.
Creating this analysis, we are just before the meeting of the US FOMC. Consequently, we are awaiting the decision on US interest rates. We expect that it may significantly affect the further movements of Bitcoin. However, for the 50-day SMA to be pierced, it is worth watching the volume. This one needs to increase significantly.
The next resistance level we will be watching is the local peak near $28,145. Support, on the other hand, will be the recently reached low, at exactly $24,920.

Bitcoin’s dominance makes leaps between supports
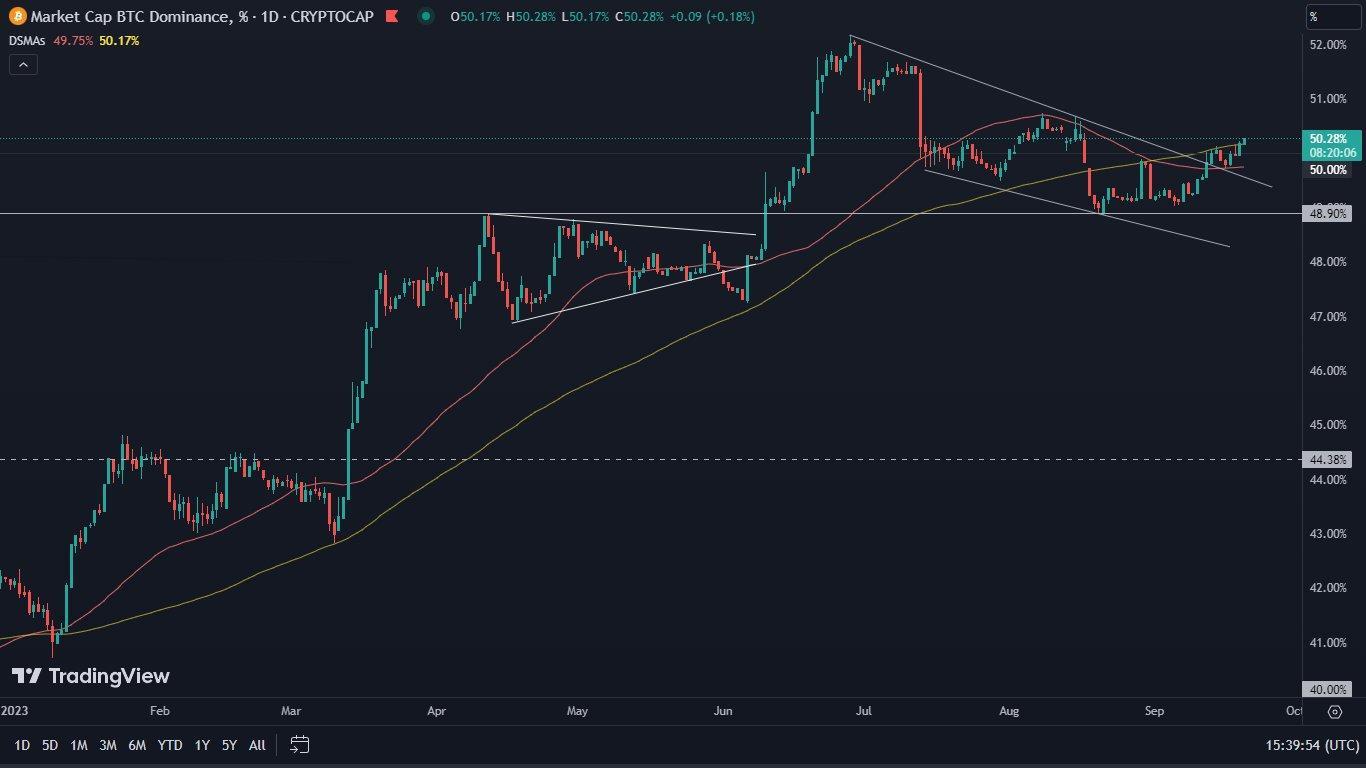
Bitcoin has been forming a descending pennant on the dominance chart over the past few weeks. This formation, by virtue of the fact that it is bullish, usually results in upward breakouts. This is also what happened this time. After the breakout, not only the upper boundary of the formation was tested as support. Along with it, the same happened with the 50-day SMA. The breakout from this area was so strong that BTC instantly reached the 50% level, and thus reached the 100-day SMA. At the time of writing this analysis, this level is being tested as support. Looking historically, its significance is remarkable. If it is maintained, bitcoin to altcoins will begin to gain again.
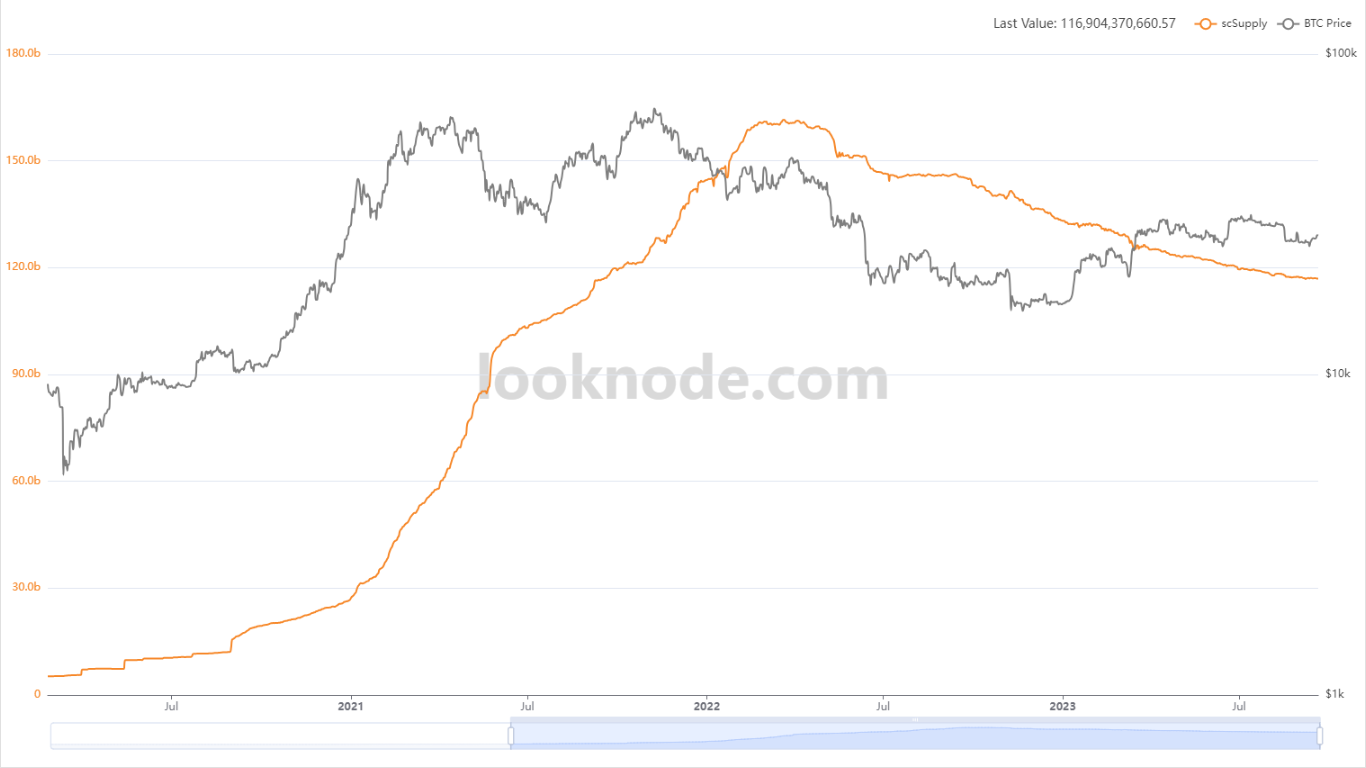
New capital is still not coming in
In order for Bitcoin (like other cryptocurrencies) to enter a decisive upward movement, an influx of fresh capital is necessary. This manifests itself in an increase in the number of stablecoins in circulation. Unfortunately, such a phenomenon is not currently observed. Nevertheless, on the chart provided by the analytical platform Looknode.com we can see a kind of flattening. It may indicate a local bottom and herald an upcoming rebound.