The bulls have definitely come to the force. Thanks to them, for the current moment Bitcoin is struggling to hold key levels. Let’s answer the question of which ones to hold in order to think about the continuation of the bullish wave and where the final confirmations of the trend reversal are located.
Current situation
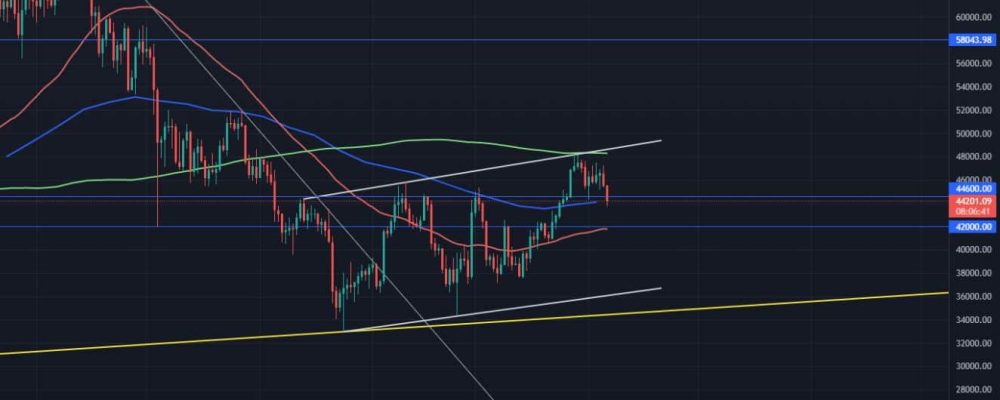
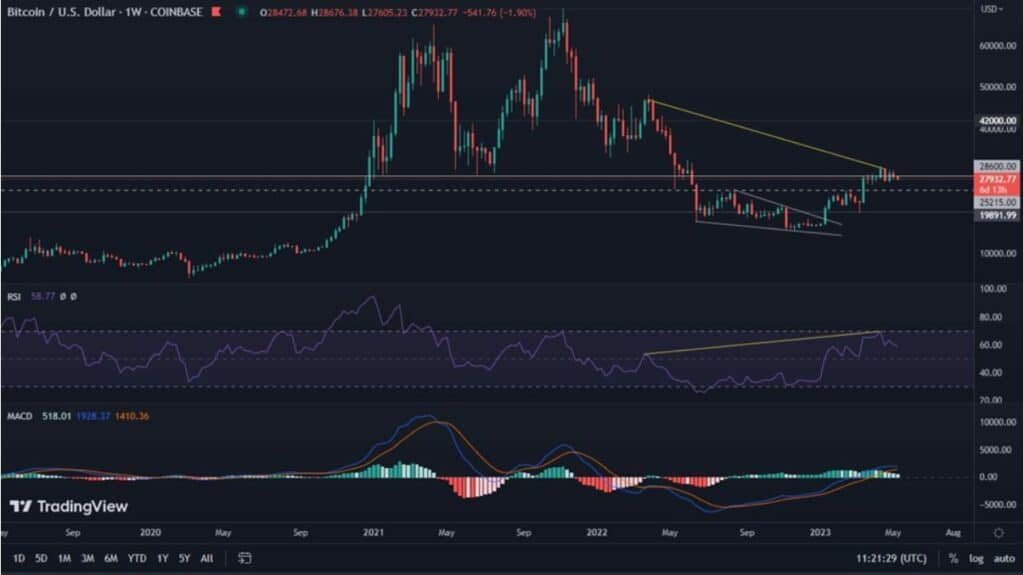
The opening of the Bitcoin 2022 conference, held in Miami, brings a correction to the chart. This is nothing surprising, given that the market likes to buy rumors and sell facts, conferences among them. Nevertheless, after the recent rally, we see that the leading cryptocurrency is struggling to hold the level of the 20-week exponential moving average (EMA), indicated by the blue line. In late March, for the first time since early December, BTC found itself above this very line. This is a very important sign, as historically the calm holding above the indicated area, suggested a period of sustainable growth. Thus, the first key level for sustaining the rally is the weekly price close above the 20-week EMA. In addition, $44,600 is also an important price level. Each trading day closing above, is a very bullish signal. A possible breakout of the indicated areas could take Bitcoin to the 50-day SMA, located near $42,000. This is a very important area we are already familiar with and at the same time the second most important area to defend. A bounce from it will shape the next higher low and sustain the trend.
At what level will the bulls get the final confirmation?
Looking at the chart however, we should not ignore the potentially forming ascending channel, which after a long period of declines is definitely a bearish formation (white lines). At its upper border, the green line marks the 200-day SMA which is the next resistance. Getting above their area is a key, yet not definitive region indicating further upside. For more precision we are helped by the Fibonacci retracements.
We can see on them the level of 0.5. Breaking out above, there is a chance for a move towards a new All Time High. Additionally, this level coincides with the local price resistance at $51,000. The convergence of factors means that breaking out of this area will be very difficult and if so, its importance for the market is very high.
Meanwhile, descending to a lower time interval (in this case 4-hour), we see a bullish flag forming. Its price range, once broken out, is very easy to measure. It already shows that the possible positive play of the formation should take the price of BTC above $55,000. This is very optimistic news indicating in that case that the bulls will definitely take control of the market. Nevertheless, given the mentioned smaller time interval, this is a second order formation.
On the current occasion, it is also important to remember that April has begun. This is the time when a significant part of investors, especially institutional ones, start the process of distribution of their assets. It may last up to two months. If their supply strength exceeds the current demand strength, we can expect declines. Thus, bulls in the coming time will undergo a real test of strength. However, if they win, the next months for Bitcoin could be impressive.


