The event that many investors have been waiting for has become a reality. A golden cross has appeared on the daily chart of Bitcoin. In today’s analysis we will look at, among other things, its historical impact on the price. We will check whether it really is as bullish a signal as many assume.
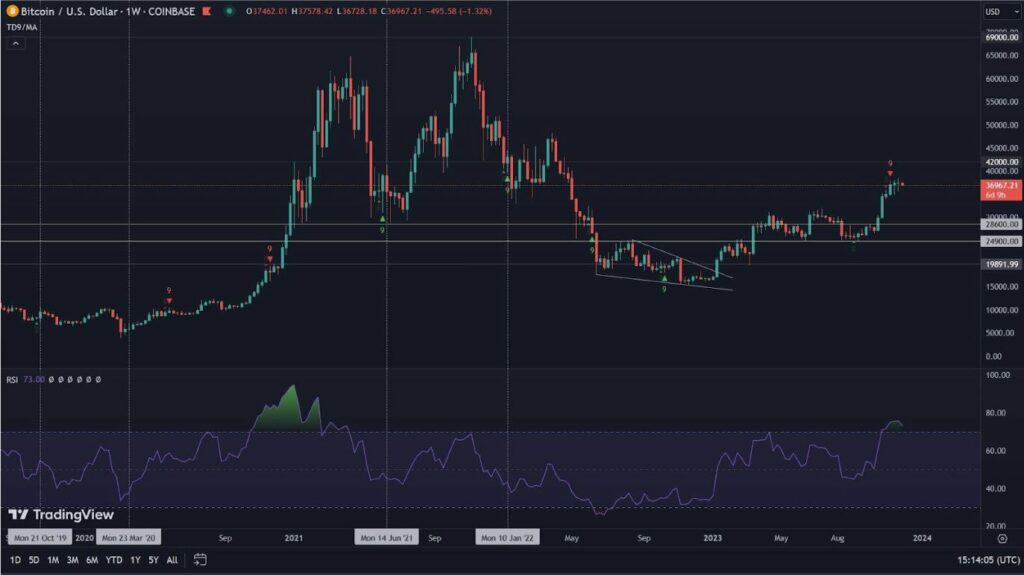
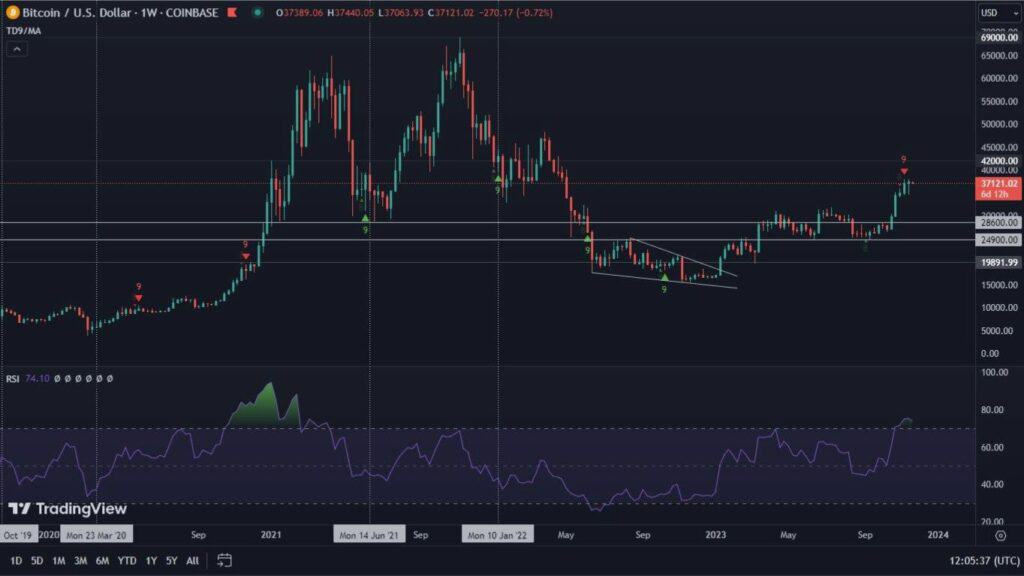
Bitcoin on the weekly chart
However, before we move on to the golden cross, we will look at the Bitcoin chart from a further perspective. This is because here there are several factors that prompt us to sharpen our vigilance. The weekly interval illustrates a 3.4% decline in the value of BTC. A very clear bearish RSI divergence is also visible. Keep in mind, however, that it may be significantly stretched and may not immediately affect the reversal of the price action. In addition, the 200-week moving average (green line), located in the horizontal resistance zone, is located in the vicinity of $25,000. The combination of these factors could influence the rejection of a possible attempt to break through this area. Meanwhile, the stochastic RSI is making a bearish cross and also heading downward. On the other hand, a positive factor is the RSI itself, which remains above the 55 level, which still gives a chance for a bullish continuation.
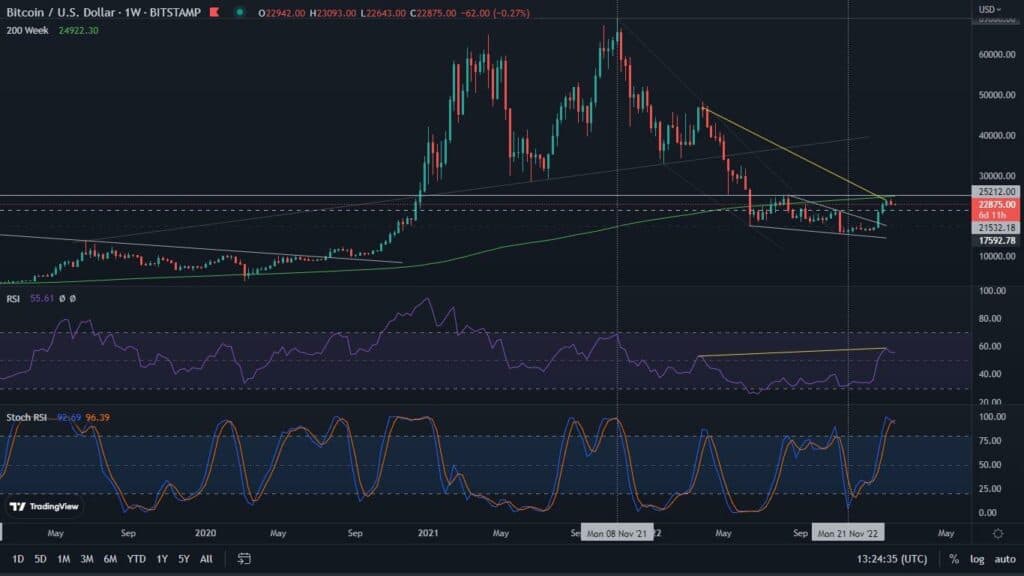
Meanwhile, the expected death cross between the 50-week and 200-week SMA is still unconfirmed. It is, however, inevitable. Its appearance has the right to strengthen the bearish narrative.

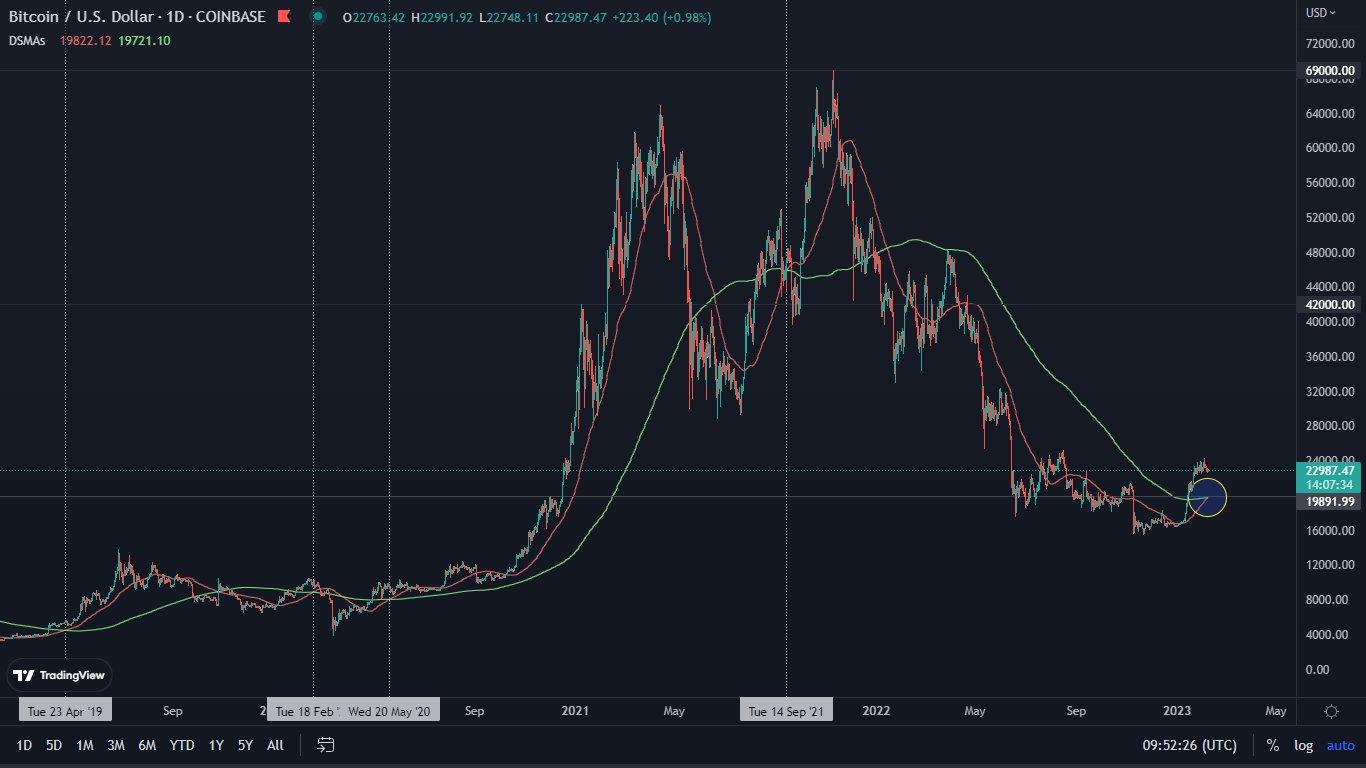
Bitcoin on the one-day chart presents a golden cross!
While the weekly chart expects a death cross, the same moving averages, with respect to the daily chart, form a gold cross.
Looking at the data, we see that this event, although popular, occurred extremely rarely. Recall that a golden cross is defined by the moment when the 50-day moving average crosses the 200-day moving average from below. What was the history of this event so far? Let’s check it out!
January 2012: -39% in 29 days,
July 2014: -76% in 183 days,
July 2015: -29% in 39 days,
October 2015: +69% in 7 days (and +6592% in 781 days),
April 2019: +159% in 64 days,
February 2020: -60% in 24 days,
May 2020: +28% in 89 days (and +573% in 329 days),
September 2021: -16% in 7 days (and +46% in 57 days).
As we can observe, the golden cross did indeed contribute to Bitcoin’s value increases. However, this occurred mainly at the beginning or during the bull market. Meanwhile, declines also took place. So are increases still possible after its completion? By all means, yes! However, investment decisions should not be made based solely on this one factor. It is worth looking for confirmation among other indicators.
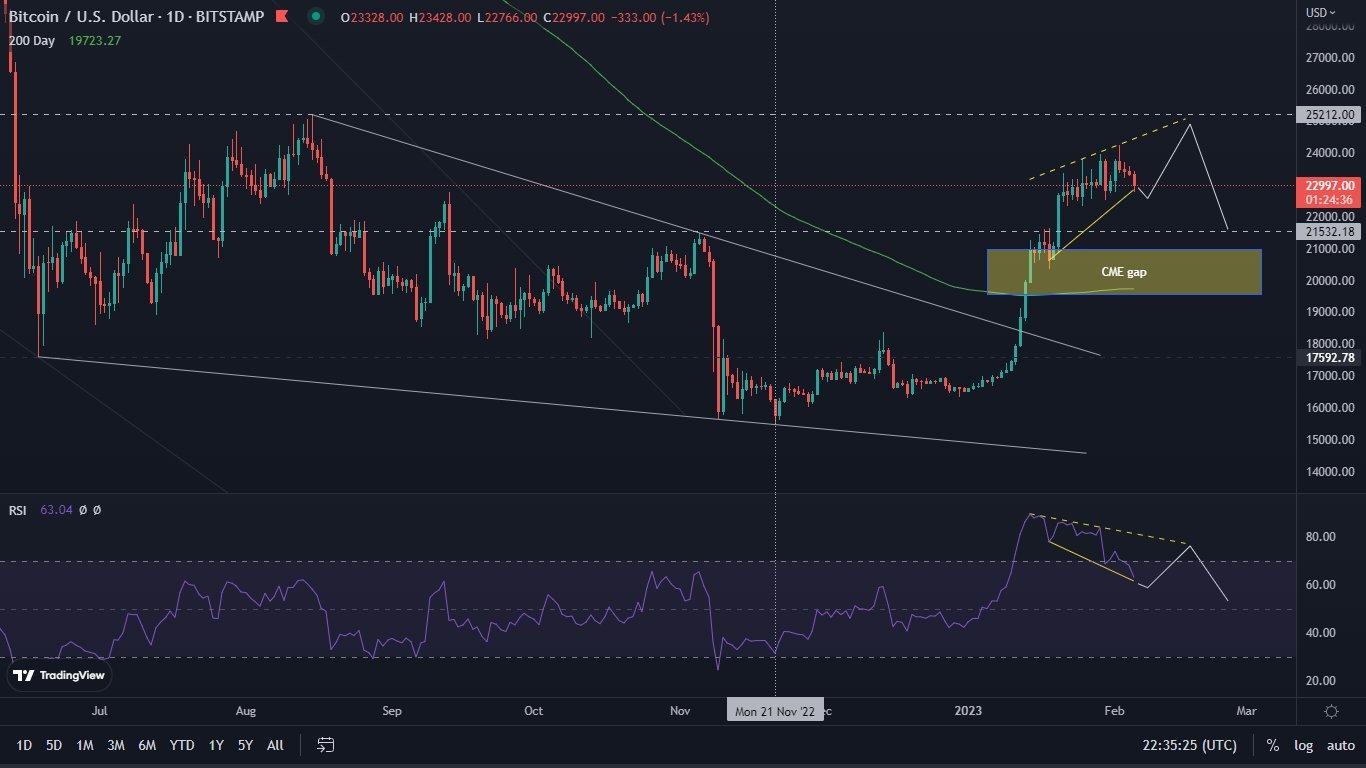
What lies ahead for Bitcoin in the near future?
Meanwhile, the local price action is again closing in consolidation. In the chart below, we have outlined what we believe is the most possible scenario for it to play out. The dashed horizontal lines indicate support and resistance. The chart, juxtaposed with the RSI indicator, reveals simultaneous bullish as well as bearish divergence. A gentle pullback in price and an attempt to attack $25,000 therefore seems highly likely. A bullish divergence would be played out here, which would consequently strengthen the bearish one. However, a possible leap over the designated resistance and confirmation of it as support has the right to lead to another stronger upward impulse. In case of declines, it is worth watching the behavior of the price between the CME gap and the $21,500 area.