Bitcoin is breaking out of key resistance and may just be moving for a new ATH. Let’s take a look at the market situation of the king of cryptocurrencies and what is happening in the altcoin market.
Is $65,000 in range?
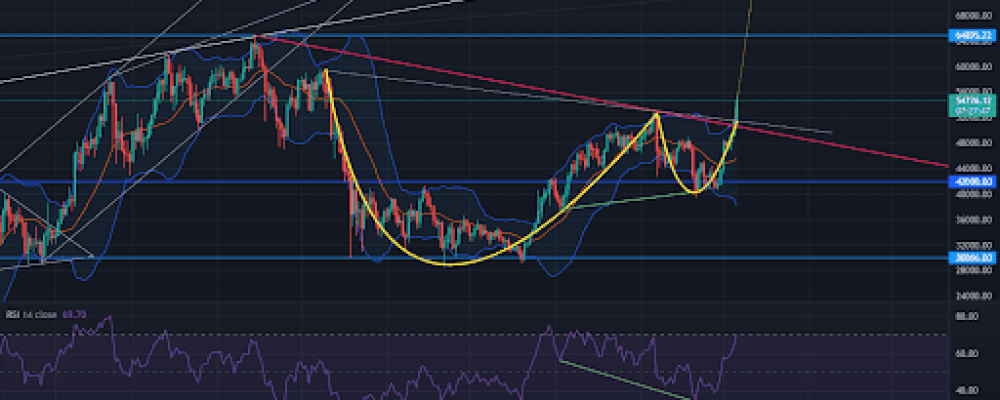
Looking at the Bitcoin chart, we can observe the breakout of the downtrend line, located at the time of the breakout at the level of $50,700 (pink line). This situation took place on October 5. Importantly, the very next day, Bitcoin confirmed the previous resistance as support, bouncing dynamically from it. This situation completely changed the market sentiment, where almost immediately on the Fear and Greed indicators we moved into the greed zone. So does this rally have a chance to continue? Well, there are many indications that it does.
The basis to think so is the bullish divergence on RSI (green lines), which spans almost two months. Such a long period indicating the price anomaly has a right to extend the period of increase. We can also observe a “cup and handle” formation, outlined in yellow. If this is what is currently in play in the market, then the price range over the next month or two could potentially be as high as $80,000. Importantly, this is the area where resistance is located, resulting from the combination of Bitcoin’s June 2019 peak in value, along with the April 2021 peak. Of course, local resistance is expected, as we mentioned in earlier analyses. The short-term trend reversal is signaled by the distribution of the Bollinger Bands, on which Bitcoin is temporarily overvalued. This may suggest a return of the price to the vicinity of $53,000, a level that was local resistance exactly a month ago. In such a situation, BTC catching its breath has the right to fuel further growth.
What do altcoins have to say about it?
With few exceptions, we can observe that the altcoin market is even bleeding, giving up the field of domination to Bitcoin. This one once again bounced off the 40% capitalization value of the entire market and is going up dynamically. Here, too, we observe the exit above the upper limit of the Bollinger Bands, which may confirm the necessity of a correction and an opportunity for altcoins. Looking for any resistance, on the other hand, we should pay attention to the trend line, which is currently oscillating around 47.5% (marked in white). Historically, Bitcoin has bounced off it many times. It should therefore provide resistance and allow altcoins to temporarily increase their strength.
One of the coins that are doing relatively well against the USD, but not necessarily equally well against BTC is Ether. On its chart we can observe a dynamic breakout from a descending pennant formation, which is a part of a bullish flag. This way we can determine the range of the breakout. In the long-term perspective it is as much as USD 5,500. If Bitcoin’s situation played out according to the cup-and-handle scheme, Ether following the largest cryptocurrency has a chance to reach this region. In the meantime, however, it should encounter strong resistance near $3,900, formed by the trendline connecting the previously reached ATH and the subsequent local peak. Similar to Bitcoin, ETH is also experiencing a bullish RSI as a catalyst for the current upside. The potential for a cup-and-handle formation is also evident here.
Plan B and its prediction
Plan B, one of the leading market analysts and also the creator of the famous Stock to Flow model, predicts that Bitcoin will end the year above $135,000. Whether this will happen is hard to determine. However, so far, his predictions have been flawless. The next target therefore becomes the October close above $63,000. Given the formations we have observed, we think that this target is possible to achieve.

