Bitcoin had been facing a resistance zone for a long time, which it was ultimately unable to overcome. The result was a correction, taking the price of the asset down to the earlier consolidation zone. Meanwhile, an unbelievably effective convergence of two indicators has emerged so far, suggesting that the current rally has come to an end.
Bitcoin on the weekly chart
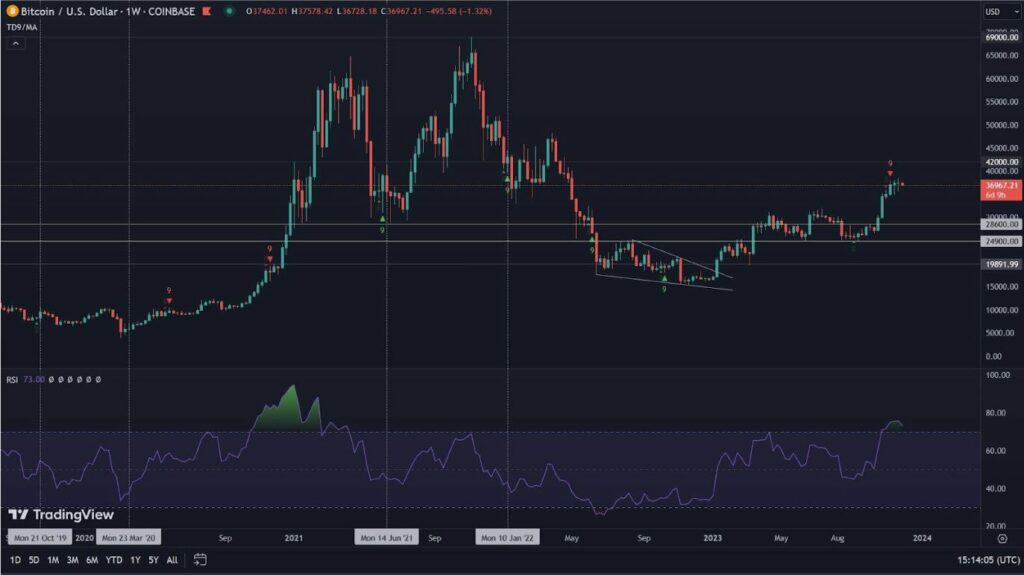
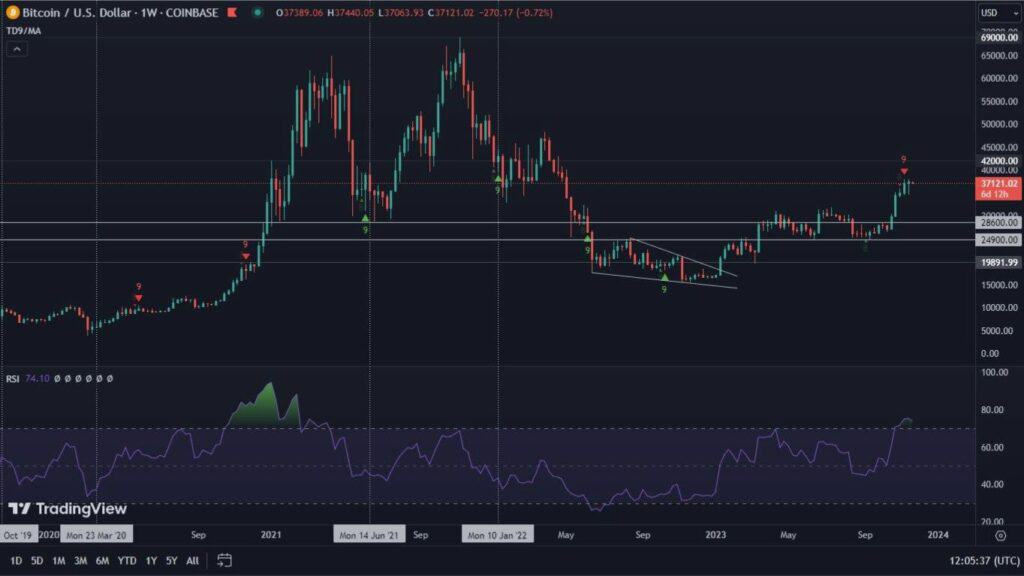
The past week ended for Bitcoin with a decline of 9.0%. It thus wiped out the gains investors had made over the past 21 days. It is worth noting that with this, BTC is respecting a clear resistance zone. The RSI remains in a very wide bearish divergence, which is still subject to widening. MACD is again showing bearish momentum. However, we suggest treating this indicator with a pinch of salt, as its momentum has been unusually high recently. A positive signal, on the other hand, is the RSI itself, which continues to maintain healthy areas, noting a value of 59. A warning signal, on the other hand, may be the Stochastic RSI, which is leaving the overbought zone.
Two indicators that suggest more decline
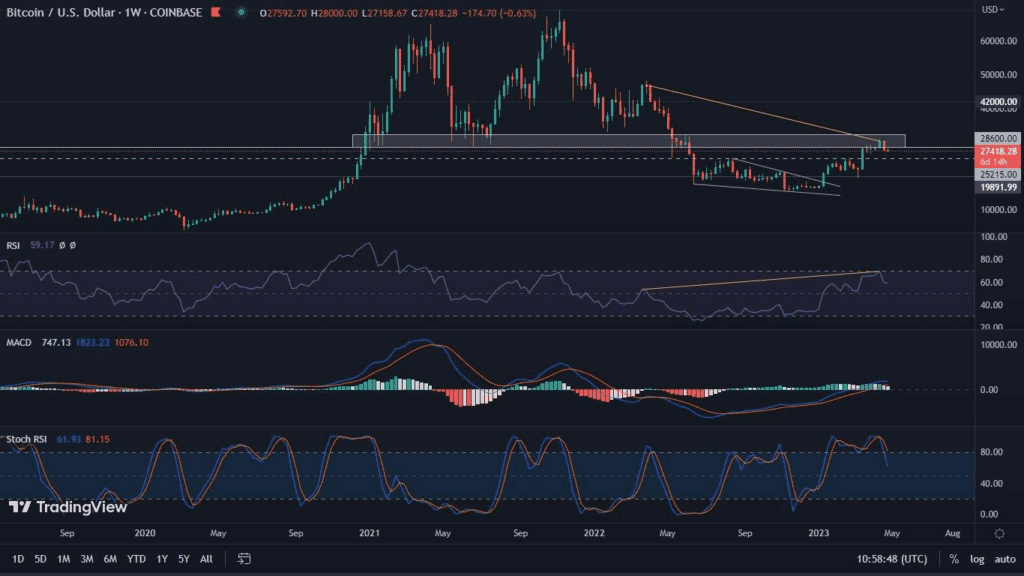
Last week, we pointed out a very interesting relationship that exists between the RSI and the Stochastic RSI. Since the 2017 peak, every time the RSI on the weekly chart reached the overbought zone and the Stochastic RSI formed its second peak in the same area, a strong correction followed. The shortest of these lasted 2 weeks, others lasted much longer. Interestingly, just after we pointed out this correlation, Bitcoin lost 9.0% in value, confirming its effectiveness. Given that the leading cryptocurrency did this by bouncing off a resistance zone, the hypothesis of a potential local peak in the price, takes on more significance.
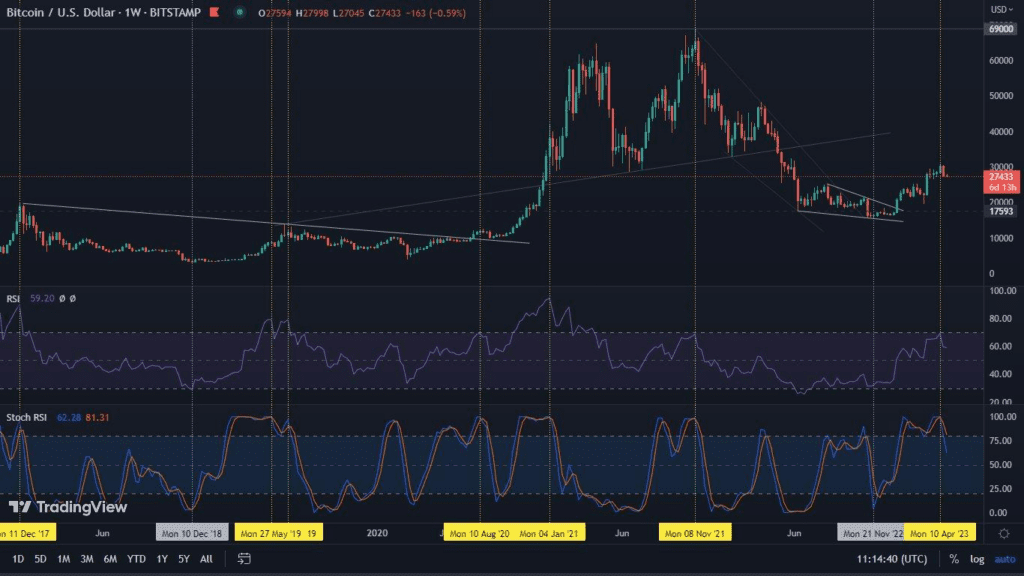
The correlation of the two indicators thus appears to be a clear warning signal. If this is the case, any bounce on the daily chart (which we’ll get to in a moment), is only entitled to obtain exit liquidity. The effect of this is that the correction still may not be complete, and that even if the ongoing week closes in the green.
Bitcoin on the daily chart
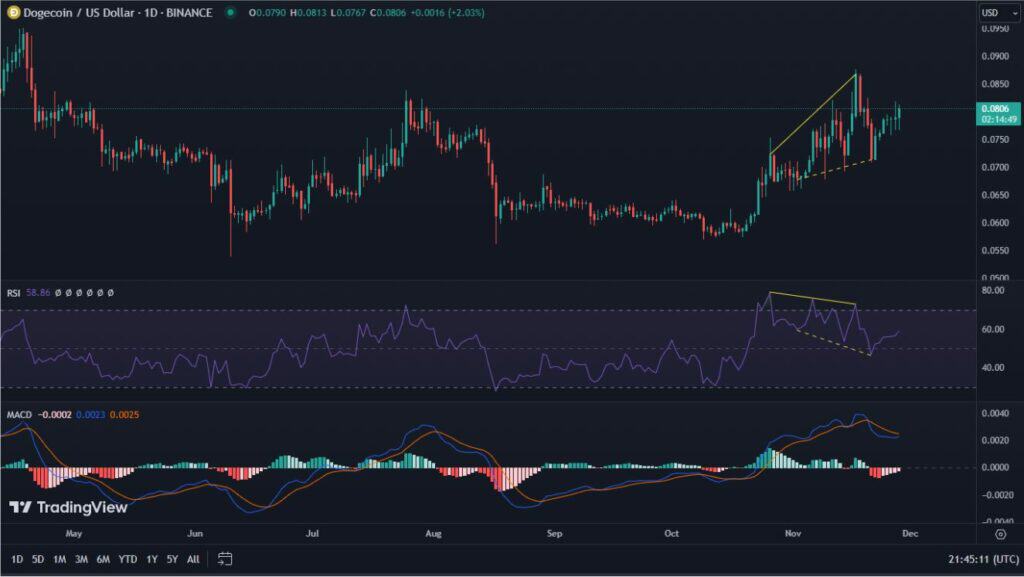
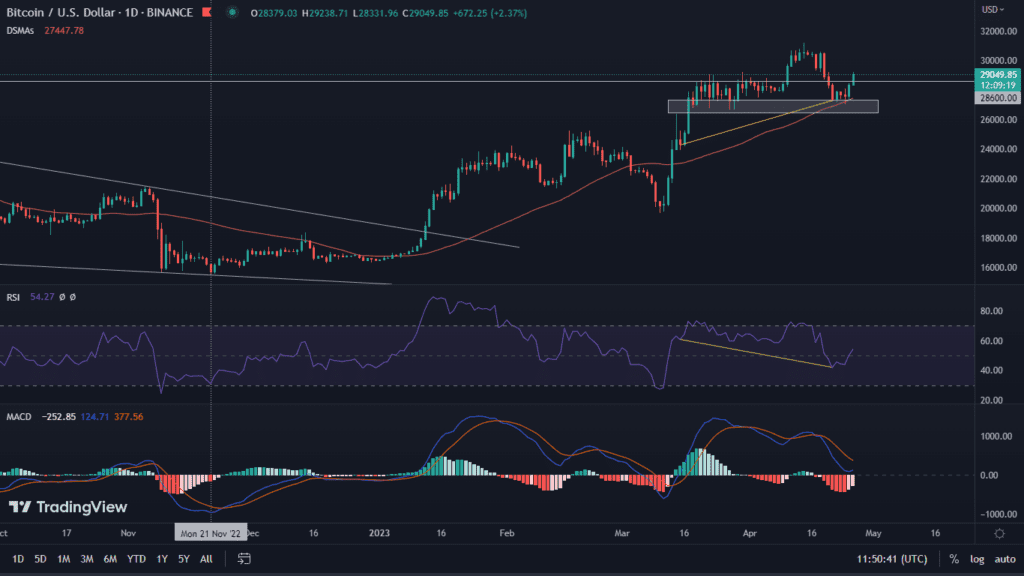
Bitcoin on the daily chart is very different from the picture we see on the weekly chart. The declines that the leading cryptocurrency has been experiencing recently resulted in finding support at the lower area of the previous consolidation. In addition, the rebound is exactly from the 50-day moving average. It is accompanied by a bullish RSI divergence, as well as a bullish MACD.
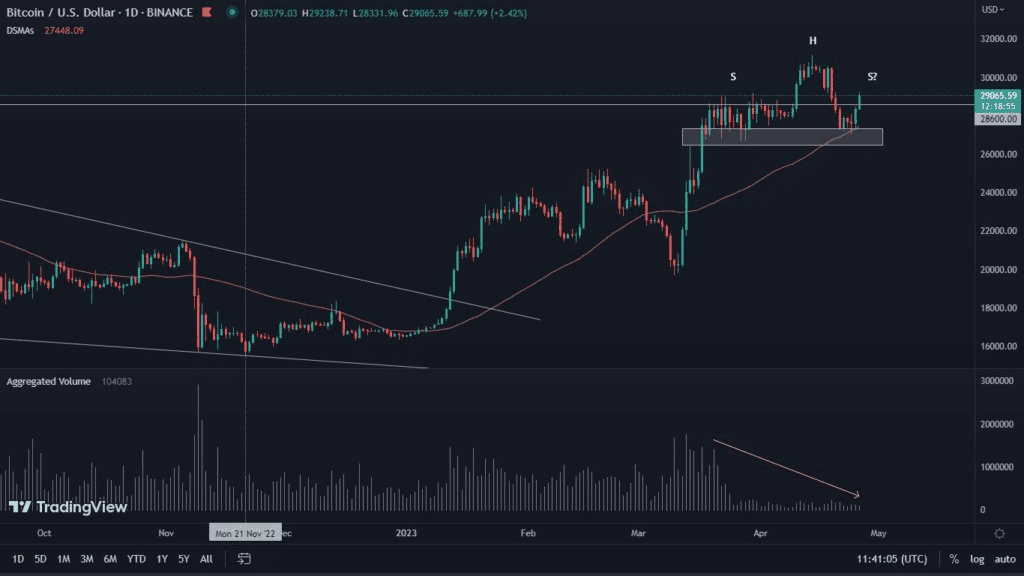
However, another issue is of concern. Hypothetically, Bitcoin is currently forming a Head and Shoulders pattern, which is formally a trend reversal formation. This theory is confirmed by volume, which is currently at extremely low levels. In order for the pattern to be considered reliable, the value of volume with each successive bounce must be lower, or remain at levels close to previous ones, which is exactly what is happening.
Certain events may be stronger than technical analysis
Although, in our opinion, Bitcoin’s chart does not look as bullish as it may seem, certain events may have the effect of negating the bearish hypothesis. We are referring to the condition of the banking sector in the United States. The last few days have brought a series of negative news about First Republic Bank, which is facing huge troubles, resulting from reported losses in deposits, and consequently gigantic drops in the value of the institution’s shares. If confidence in the banking sector is once again damaged, Bitcoin’s rise above the resistance zone (above $32,400) is still possible.