Bitcoin scored levels below USD 40,000 and immediately rebounded. Does this relapse suggest a bottom has been reached, or are we still in a downtrend?
Struggling for reliable support
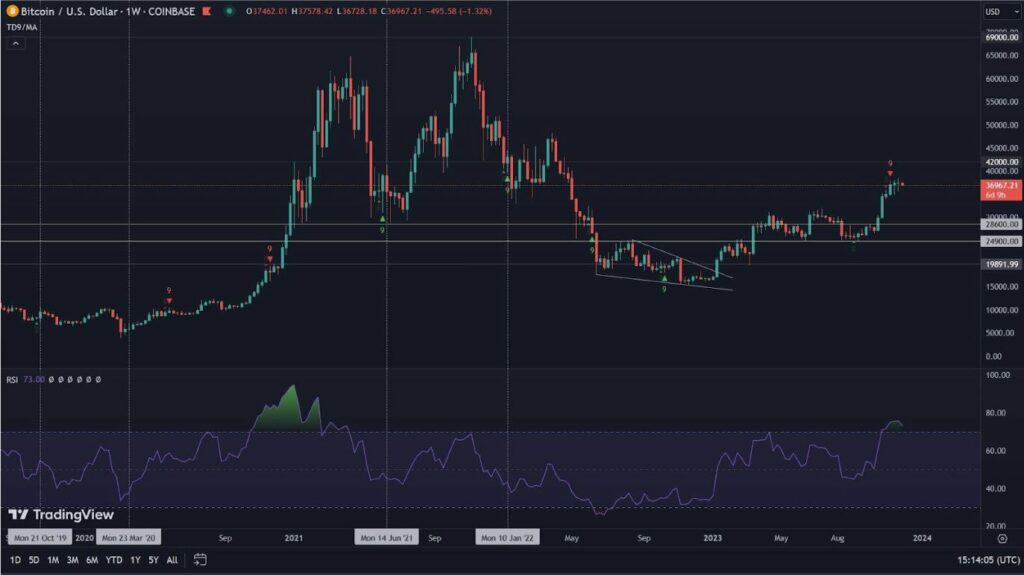
The situation on the Bitcoin chart looks truly dramatic. Not surprisingly, fear is the prevailing sentiment at the moment. The leading cryptocurrency failed to withstand the long-term support marked by the green trend line, and at the same time failed to resist the USD 42,000 level, diving below this very limit. However, things don’t look all that unpleasant. Let’s turn our attention to the pink line, which until recently was a key resistance to the steep price decline. After its breakout, so far, the price remains above its level, which is a bullish sign. However, the breakout of this line has formed another minor top, which may provide another resistance that is a hurdle to cross. We have drawn a white line based on it and importantly, a similar one is found on the RSI chart. Their presence in both places may suggest further fight against the downtrend.
On the positive side is the MACD, which points to the upcoming bullish cross, which may give impetus to further increases. The formed higher low also looks excellent. The price has gone down to September levels, but its closes still remain higher than the closes from that period. However, is it everywhere?

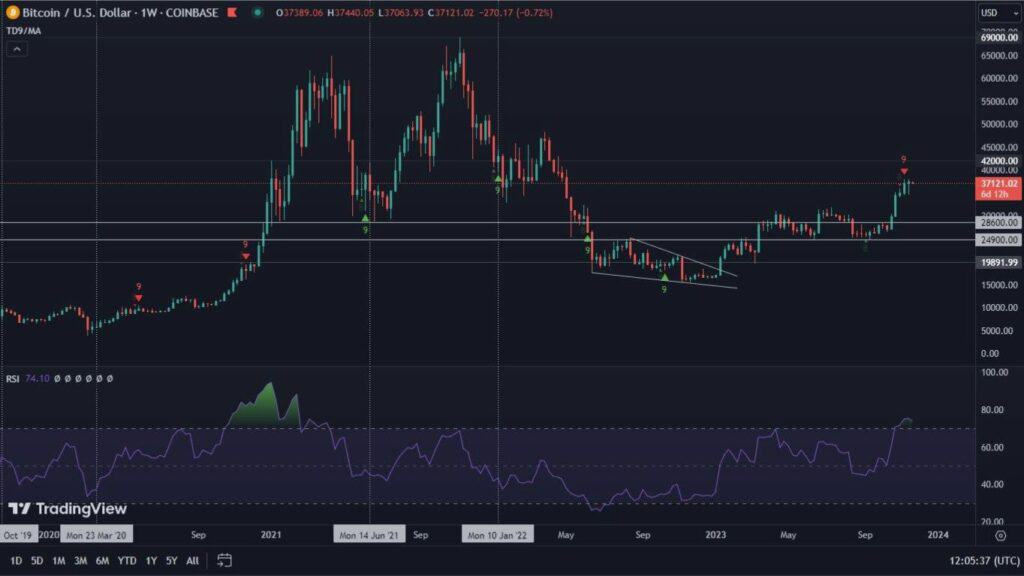
Of course, one cannot be overly optimistic. When we change the time intervals from daily to weekly, it turns out that the bottom formed a few days ago is lower than the previous one. This should make us cautious. Therefore, for the current situation to be called a full trend reversal, we should expect the white downtrend line to be broken and a new top to be determined above USD 52,000. Possible declines could take Bitcoin to the area of USD 37,000, where the next support is located.

Ethereum in a similar situation
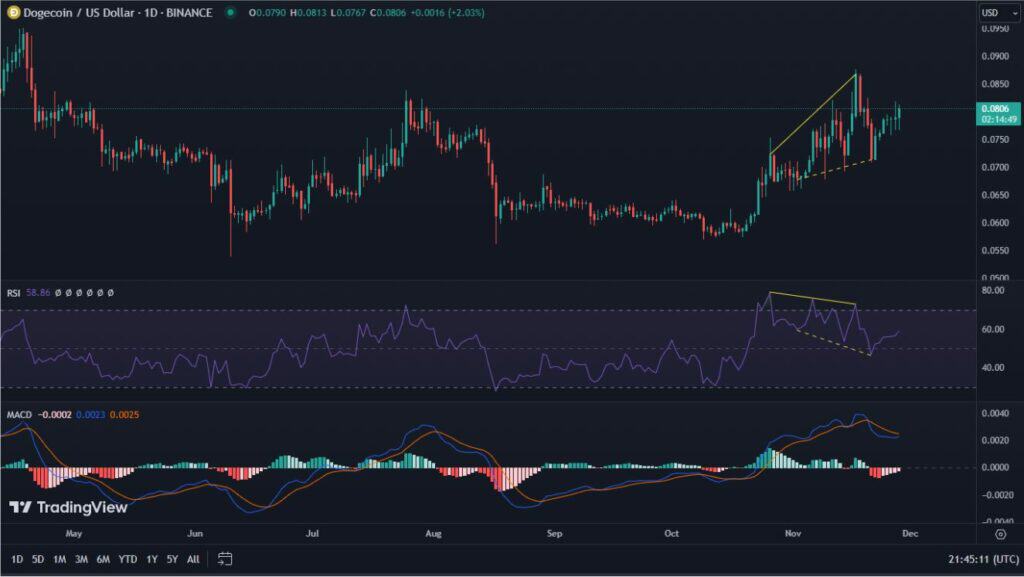
Like Bitcoin, Ethereum is also struggling with a downtrend. Here we have also marked it with a white line and placed the same on the RSI. Note, however, that the downtrend lines on the RSI are two. One continuous, which is a direct reference to the current price action, and one dashed, indicating the trend since Ether reached the ATH. Both could provide significant resistance. MACD is indicating an upcoming bullish cross, which is encouraging. The bullish RSI divergence completes the picture. This indicator performs exceptionally often, which may suggest a strong trend reversal. Increases should result in overcoming the white trend line and reaching a higher high, above the level of USD 4,000. Dips, on the other hand, could take Ethereum to the USD 2,700 level, or as low as USD 2,400, where ETH should encounter key support.

Total market capitalization chart fills double bottom scenario
Recently, when we wrote about the total market capitalization of cryptocurrencies, we indicated that it could again go down to the neighborhood of USD 1.85 trillion. This is what happened and thus the 0.618 Fibo level was reached, from which the rebound is currently taking place. The RSI divergence we indicated earlier is still in play, and it has deepened. This may give it momentum to break out. As in the case of Bitcoin and Ether, the MACD looks very positive.
An upward breakout will likely lead to a capitalization level near USD 2.25 trillion. This level coincides with the previous tops, and the 0.382 Fibo area. Dips, on the other hand, will lead to USD 1.75 trillion or even lower. The USD 1.53 trillion area is also the 0.786 Fibo level, where the next local support is located.