A significant recovery is emerging in the market. Bitcoin has reached the downtrend line, which it has been under for six weeks. Is a breakout coming up?
Decision Point
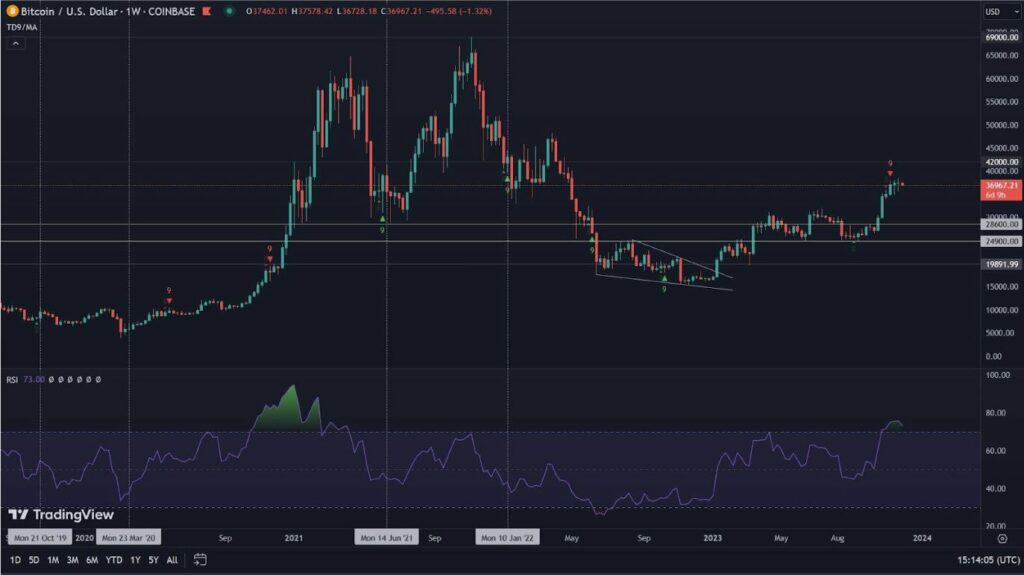
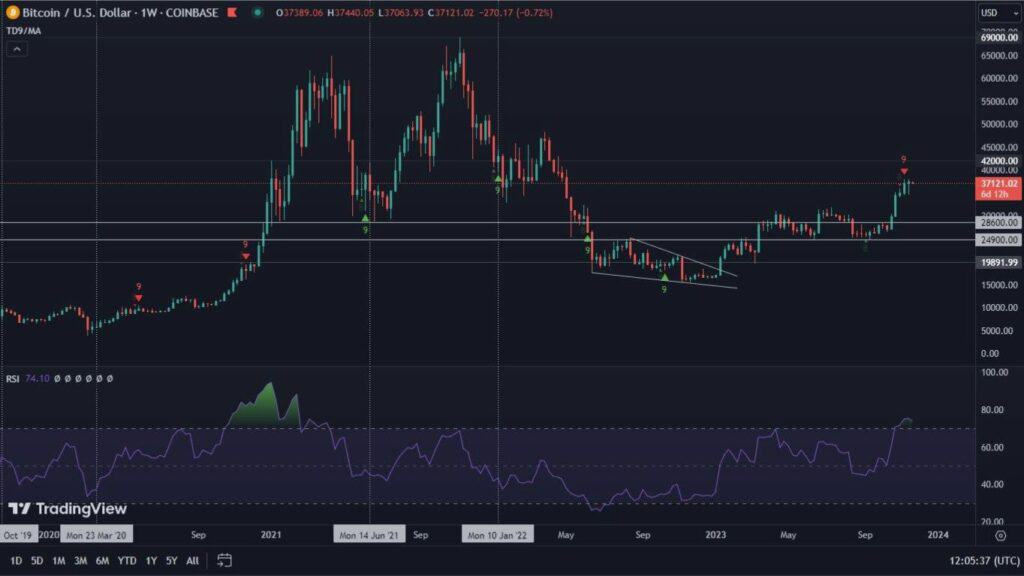
Bitcoin’s chart tells us several important things. The most important of these is that the leading cryptocurrency is steadily holding within the bullish pennant formation we have delineated. It is formed by the resistance formed by the trend line, which finds its beginning at the level of $69,000. The same counts for the support resulted from the trend line, formed from the combination of the peaks from April and September. The proximity of the former may indicate a breakout attempt. However, there is a convergence here with resistance at the price level just below the $50,000 value. This region has already provided local support and resistance, which means that it may be difficult to break through.
Noteworthy is the price behavior around the 200-day moving average (red line). We have mentioned its essence many times before. Meanwhile, we see that it has become an object of price manipulation, or more interestingly, is losing its validity. On December 17, we saw a strong decline below its value, a day later it became resistance, and the next day an attempt to break out of it ended with the formation of a candle called “falling star”. A shooting star is a candlestick form that has a small body and a much higher upper wick. It has strong bearish characteristics. On the following days, however, the candlestick broke higher. Thus, given that the 200-day moving average had already been broken earlier in the year, and the price returned above it again after a longer period of time, it can be assumed that it is losing its role.
The RSI picture is an interesting one. Here we also see an attempt to break the long-term resistance. Two consecutive bullish divergences are also present. This is quite a rare phenomenon. The first one, marked in yellow, turned into the second one, marked in pink. Such a pattern of the indicator, supported by the equally bullish MACD, is reason for optimism.

So what awaits us in the short term?
If the breakout attempt fails, we will see the price move towards the trend line supporting the pattern. Its possible breakout may result in another test of the USD 42,000 level. The positive scenario, on the other hand, should result in a breakout of the pattern and overcoming the psychological barrier of $50,000. The next resistance is located at 60,000 USD. Bitcoin reaching this region may result in a local correction and further consolidation between the mentioned values.
Ether on support
We could present the Ether analysis in two different forms. One based solely on the body of the candles, the other on their wicks. In previous posts we drew two support lines. It turns out that the Ether price reacts to both of them simultaneously. The white line is the area from which regular rebounds of the leading altcoin’s value occur. The green line, on the other hand, is the area of daily closing candles. Similar to Bitcoin, we see an attempt to break resistance on the RSI, and a bullish MACD. At the same time, the ETH price is just below the local resistance at $4.025. A surrender to the resistance, may once again force declines to the support marked by the white line. In turn, its breakout opens the way to $4,550.