Bitcoin once again fell below $30,000, only to return above that price again very quickly. Can we hope to enter a phase of regular growth, or is this just a slight bullish awakening? So let’s take a look at some interesting indicators.
From a technical point of view, there is no clarity
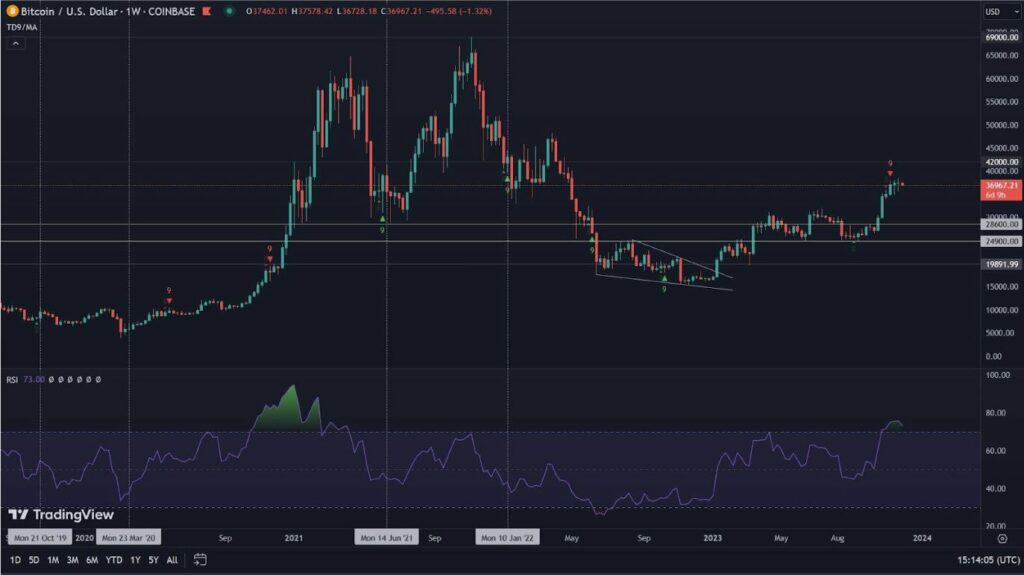
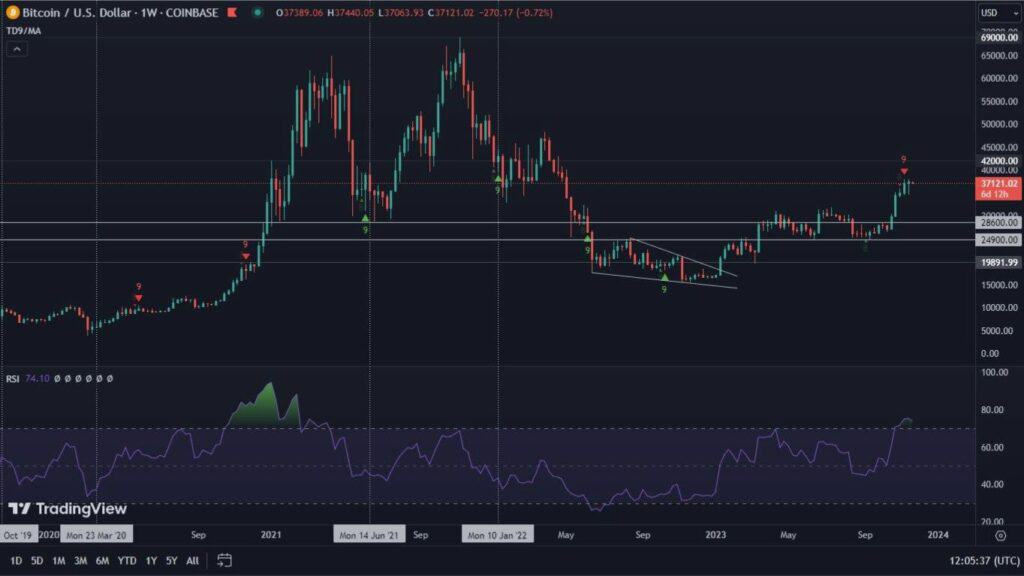
Looking at the BTC/USD chart, even without drawing any formations, we were able to observe a downtrend, heading towards another breakthrough of 30,000. Consequently, on July 18, Bitcoin closed the session with the lowest weekly value this year. Just two days later, the price of BTC fell on the daily candlesticks chart, below the previously mentioned psychological barrier. It seemed that we were in for a continuation of the trend. However, the next day we saw an almost 8% increase in the price of the king of cryptocurrencies. Such a dynamic upward movement, during a downtrend, is the so-called bullish takeover formation.
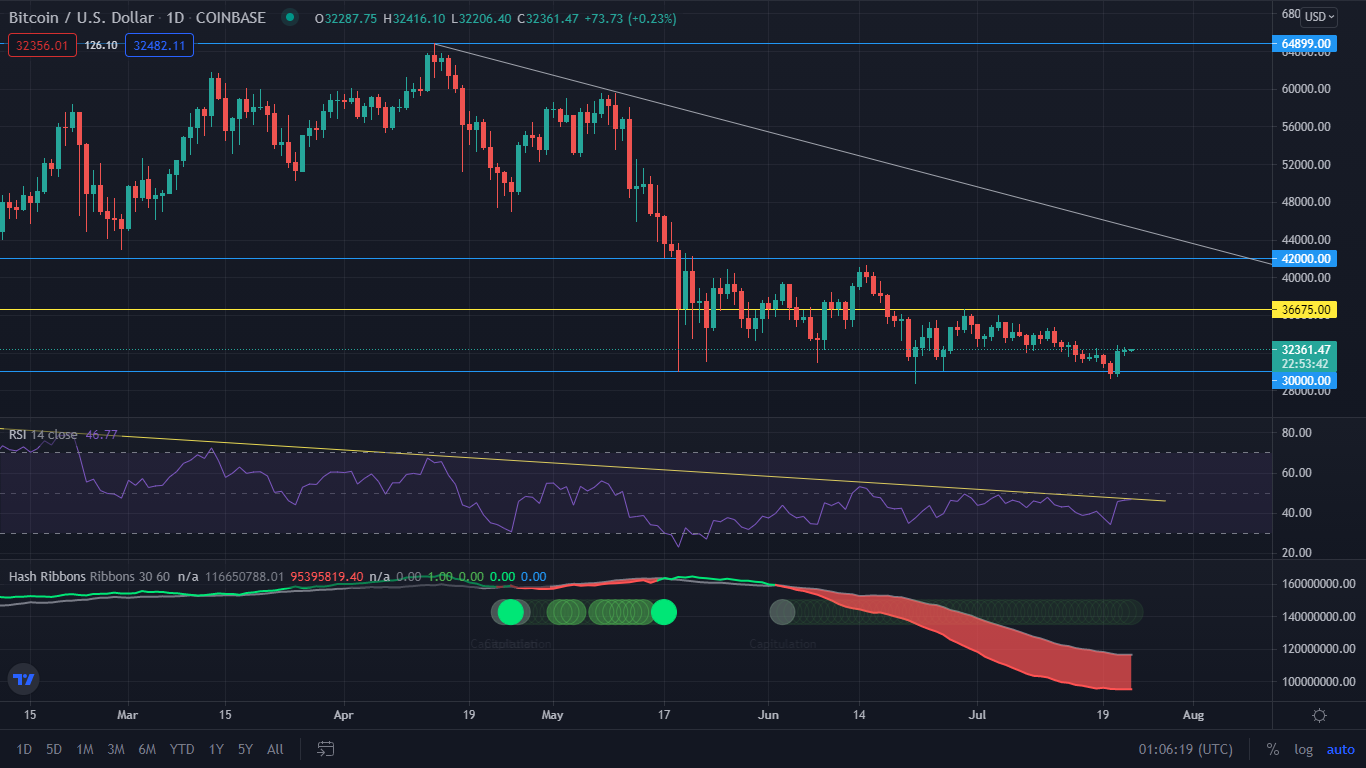
Despite breaking $30,000, it indicates that bitcoin below this amount is still treated by the market as a bargain. However, in order to talk about the bulls actually regaining control of the market, Bitcoin would have to create higher highs and higher lows on the chart. For this, a clear break of the $36,675 level (yellow horizontal line) and an attack on 42,000, which has been a key resistance for quite some time, is important. Meanwhile, in the medium term, despite the strong rebound we are constantly seeing a long-term downtrend that may continue. This pattern is confirmed by the trend line drawn on the RSI since January. Its breakout may result in a stronger upward rally. Otherwise, a deeper dive is still possible. The Hash Ribbons indicator is also far from forming a buy signal. However, there is optimism that the moving averages of the indicator have bucked the downtrend so far.
Short-term holders reach the wall
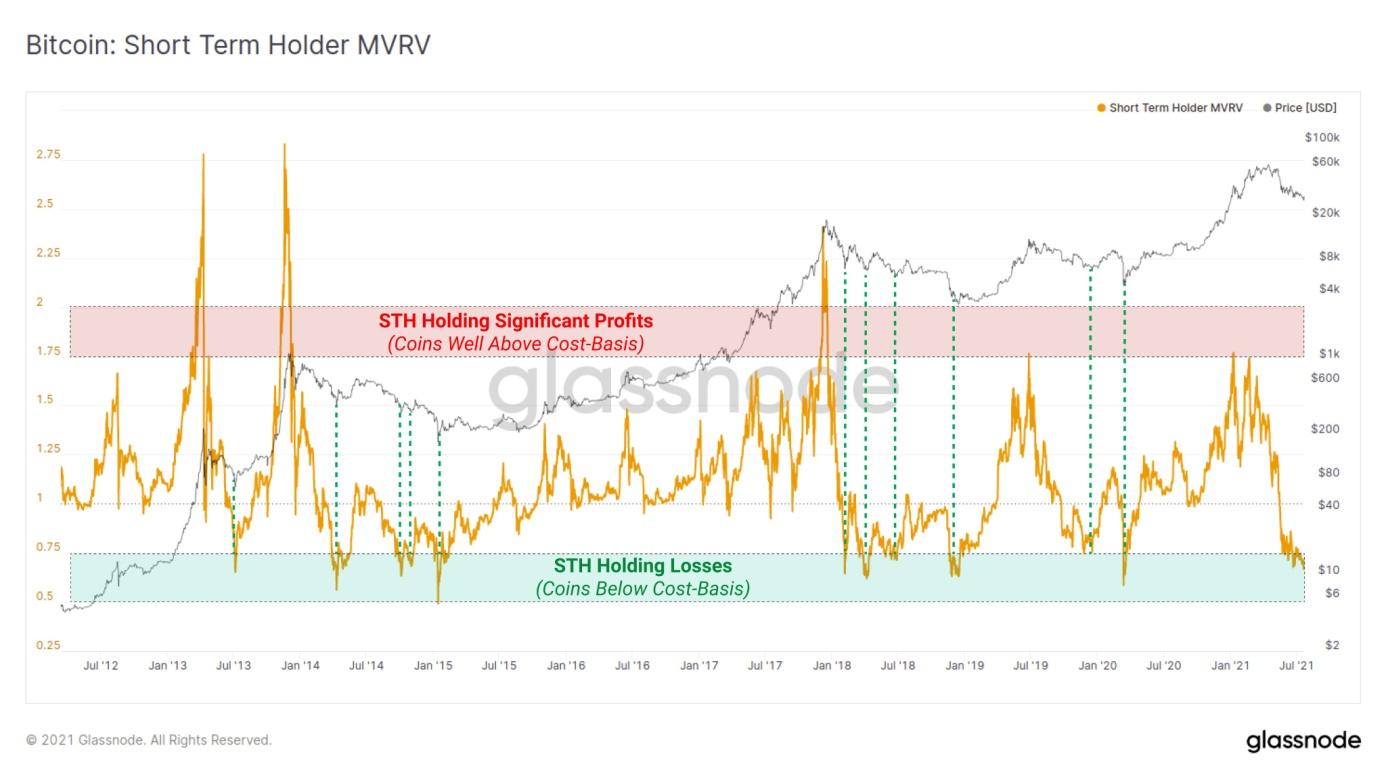
Interesting data on short term holders is presented to us by Glassnode. It takes a closer look at short-term holders. As we know, it was largely their assets held on exchanges that triggered a flurry of declines when negative news emerged from China, for example. Meanwhile, on-chain data shows that Bitcoin has reached a zone where these very investors are no longer willing to realize their losses. This does not imply an immediate upward bounce, as well as the possibility of an even deeper dive in price. Historically, however, the Short Term Holder MVRV indicator has quite accurately predicted the area around the bottom of deep corrections.
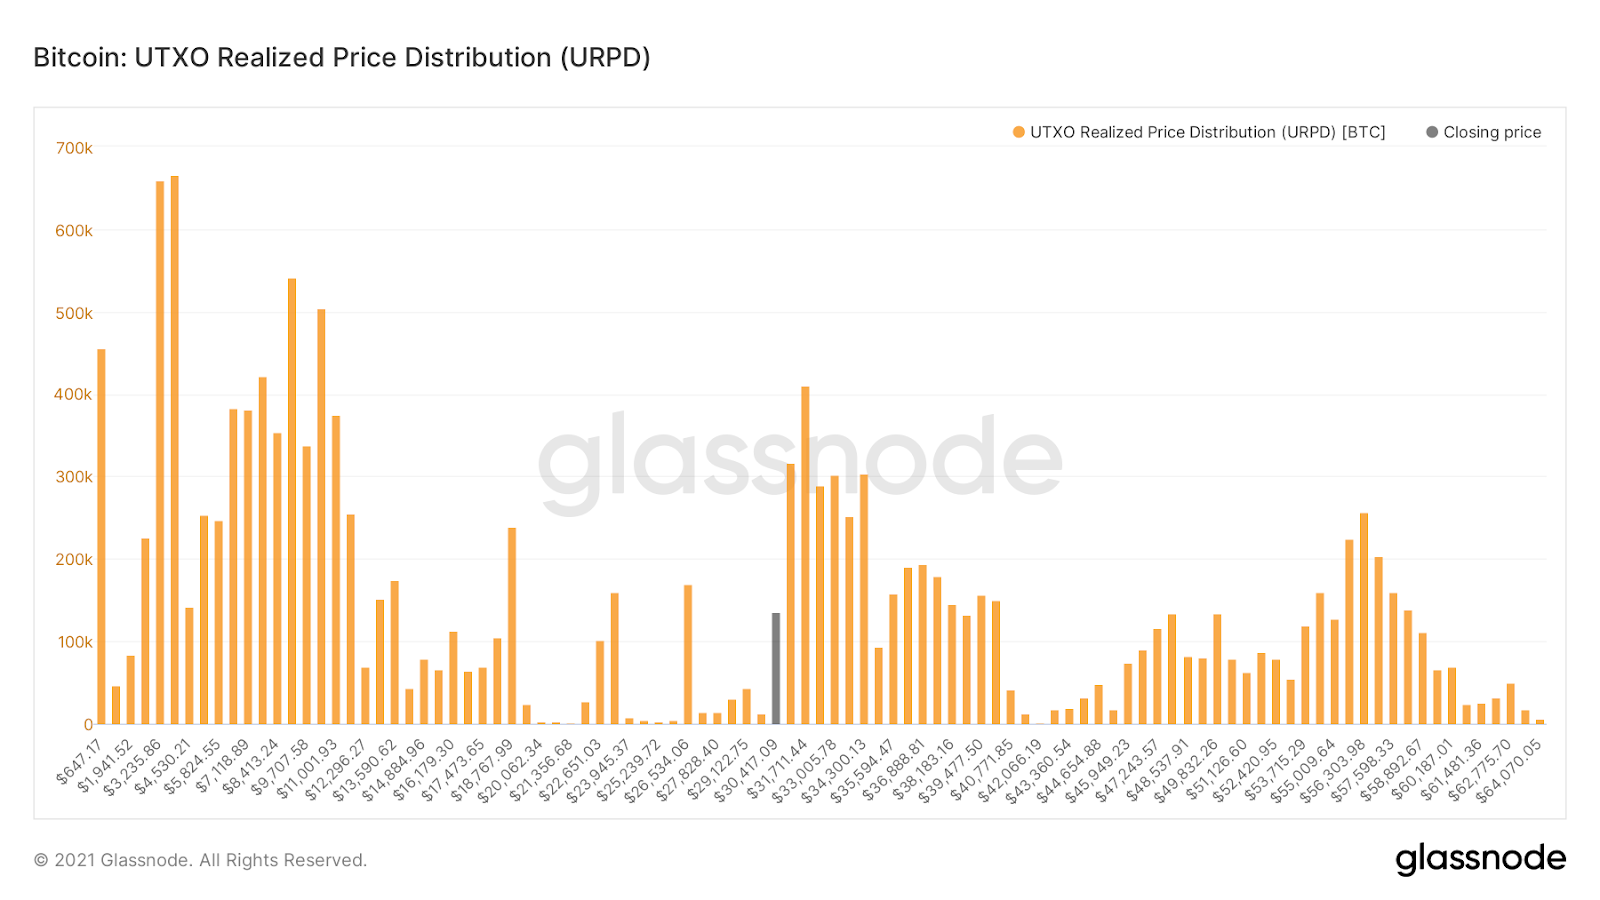
However, it is worth noting that the $30,000 zone is a key support beyond which, before reaching the 2017 peak, Bitcoin has few potential bounce points. One area where we can expect a stronger buying wave is at $26,500. A downward breakout of this zone could push the BTC price down another $3,000.
Where can we currently find ourselves in the cycle?
From a fundamental standpoint, bitcoin seems to be doing better and better. Problems stemming from Chinese regulations are rapidly being solved by miners flipping their machines to other countries. The contribution of green energy to the acquisition of BTC is also steadily increasing. Elon Musk’s words are also interesting, as when he hosted “The B Word” conference, he made it clear that Bitcoin is the future, which he also supports. So where can we currently be? The current market situation is reminiscent of 2013 and the two peaks that were seen at that time. Back then, Bitcoin also reached its new ATH in April, after which it experienced a very deep correction, followed by several months of accumulation. It seems as if BTC is in a similar phase of accumulation now. So are we still waiting for an attack on undiscovered peaks this year? Perhaps we will find out soon.