It is extremely rare to find indicators, or buying signals, that work 100 percent of the time. However, there is one that has appeared on Bitcoin’s chart a dozen times so far, and in virtually every situation has heralded a rally for the leading cryptocurrency. Note – at this very moment Bitcoin is experiencing it again!
Bitcoin on the weekly chart
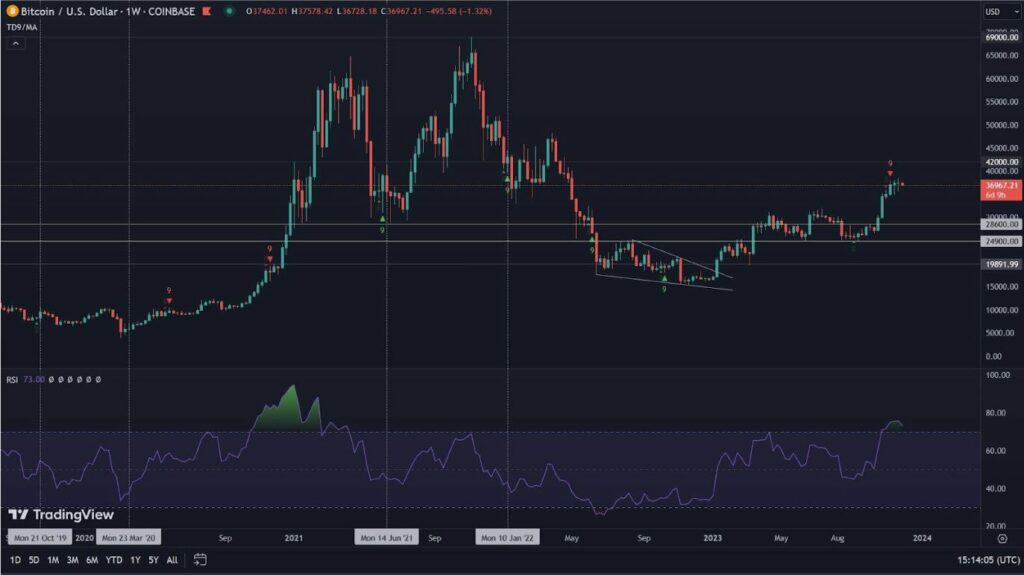
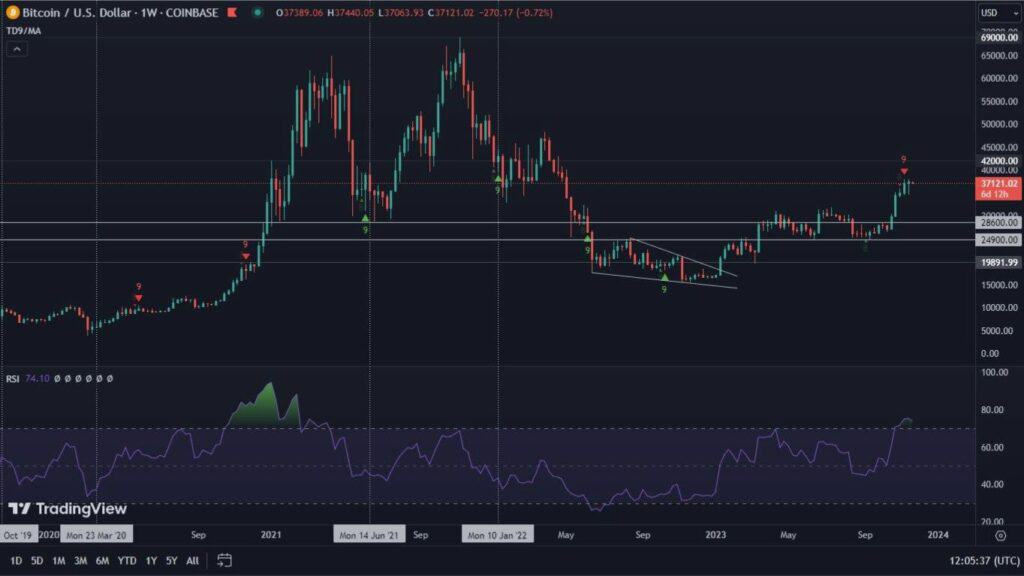
Bitcoin’s weekly chart shows a 0.8% increase in the value of the leading cryptocurrency. The RSI maintains a healthy level of 57, which clearly favors the bulls. Nevertheless, it should be remembered that Bitcoin, based on the same indicator, is under pressure from a bearish divergence. In addition, support in the form of the 10-week SMA has been lost.
Observing this set of factors and adding to them the bearish cross that has been confirmed in the past week on the MACD indicator, it can be assumed that the BTC price action looks uninviting. Nevertheless, at the same time the Hash Ribbons buying signal appeared on the chart. This indicator rubs almost perfection with its effectiveness, each time (and there have been more than a dozen of them) announcing a strong Bitcoin price rally. Slightly below, we detail its impact on the price of the leading cryptocurrency.
Bitcoin on the daily chart
Saturday, August 12 was the day when the Hash Ribbons buying signal first appeared on the daily chart. It was sustained the next day, which makes us think that it is reliable. Another confirmation of it was necessary on the weekly chart.
Although it is a fantastic indicator, the Hash Ribons ‘Buy Signal’ is not the subject of our observations on the daily chart. For here we note as many as two factors that suggest that a time of very high volatility is coming.
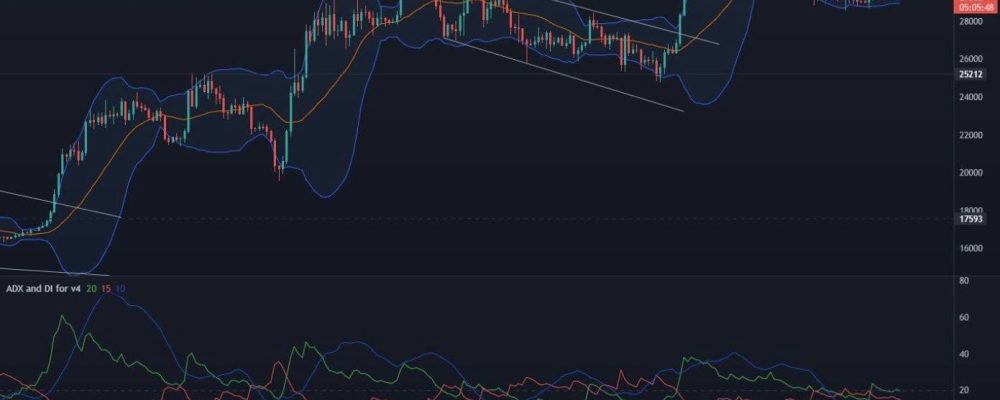
One is the Bollinger Bands, which have narrowed to unprecedented levels. There is now a space of only 2.6% between them. The last time it was similarly tight was on January 5 of this year, just before Bitcoin’s rally from the $16,850 level to $31,800.
Another factor suggesting volatility is the ADX, which suffered a complete reset, reaching a low of 6 on Sunday, August 6. It has not been this low since April 2020, the time before the past bull market.
It is worth noting that none of the cited indicators suggest the direction in which the Bitcoin price will go. They do, however, allow us to reach the conviction that strong movements are coming and that they are very close.
Hash Ribbons ‘Buy Signal’ and its impact on the price of Bitcoin
There is no denying that the Hash Ribbons ‘Buy Signal’ is by far the most effective indicator. We have already experienced it on the Bitcoin chart 14 times, of which in as many as 13 cases it unerringly indicated a price rally. In one it was ineffective. However, this situation was exceptional and fully justified, which, with the rest, we predicted at the time.
So far, the impact of the indicator on the price of BTC is as follows:
December 2011: +76% in 15 days,
June 2012: +156% in 58 days,
February 2013: +1195% in 61 days,
January 2015: +13% in 43 days,
May. 2015: +40% in 66 days,
August 2016: +96% in 127 days (and about +4500% in 469 days),
January 2019: +250% in 167 days,
December 2019: +46% in 47 days,
April 2020: +41% in 38 days,
July 2020: +35% in 36 days,
December 2020: +250% in 133 days,
August 2021: +61% in 95 days,
August 2022: -33% in 82 days,
January 2023: +60% in 120 days.
As can be seen from the above data, only in August 2022 the signal turned out to be false. Nevertheless, at that time it was not confirmed on the weekly chart. However, it appears that this time is different. Indeed, the Bitcoin Hash Ribbons ‘Buy Signal’ is present on the weekly chart. Its maintenance until the close of next week will therefore constitute confirmation of its authenticity.

