Bitcoin is experiencing sharp declines. However, it seems that this correction is being redeemed in no time. So, has its end come, or is it just a harbinger of a deeper price retreat? We reach out to the indicators to see what they tell us.
Bitcoin (BTC) on the weekly chart
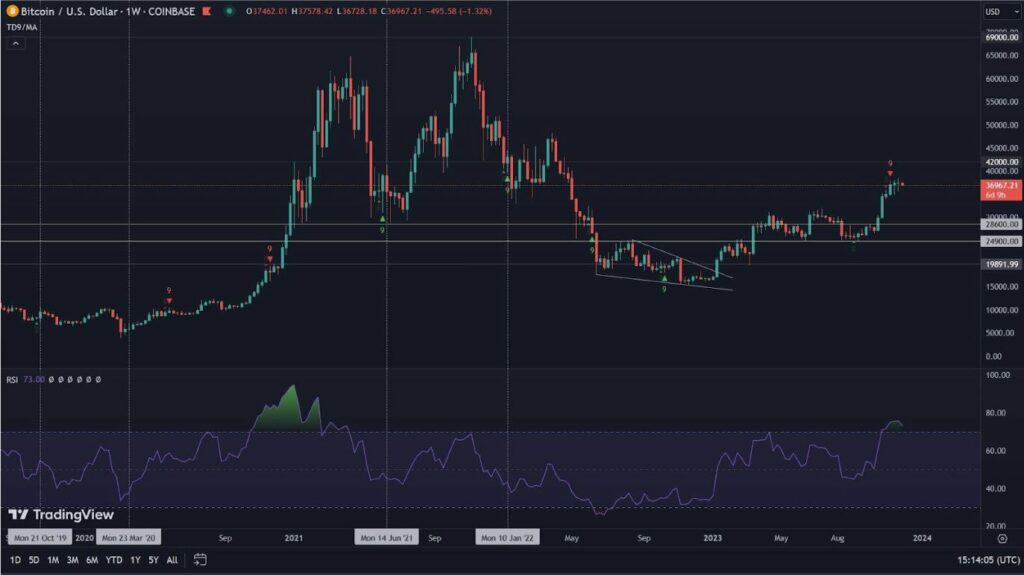
We begin our analysis with the seven-day interval. On it we see another strong green candle. This time it reflects a 9.5% increase in Bitcoin’s value. The RSI has thus climbed to the level of 83. Nevertheless, the TD Sequential consistently indicates overvaluation. Last week was the thirteenth consecutive week in which the indicator identified positive trend dynamics.

Unchanged, however, is the situation of the Stochastic RSI. For the fourth week in a row it is oscillating at extreme values, looking for a turning point to make a potential bearish cross.
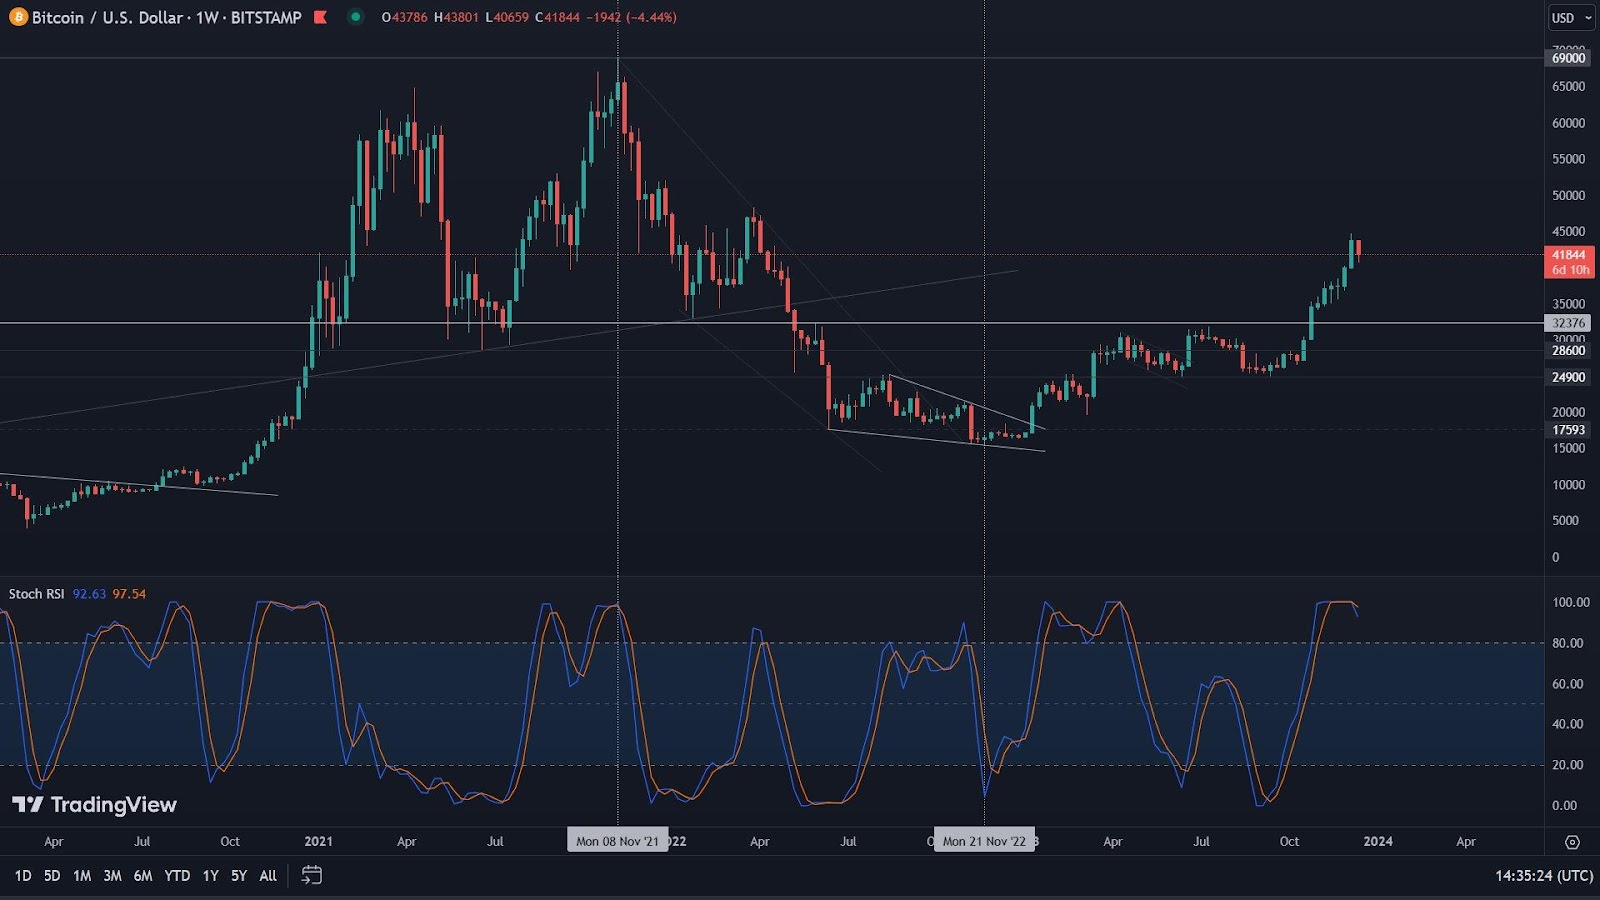
From the perspective of this interval, it is worth noting that Bitcoin is forming a new support level. It is located at $40,000. If this area is broken, the next one to look at is the $32,300 we indicated in earlier analyses. If, on the other hand, increases occur, $48,240 could be within range.
Bitcoin (BTC) on the daily interval
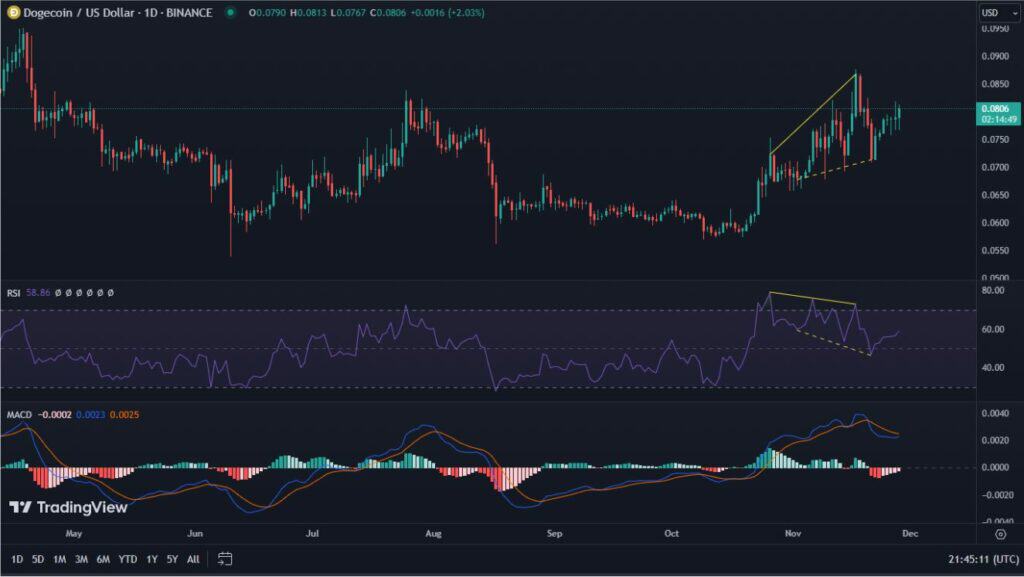
Bitcoin’s one-day chart shows the strong plunge that occurred on Monday, December 11. Bitcoin lost nearly 5.8% in value that day. At the climax, the decline even exceeded 8.0%. The main reason for this movement was the liquidation of long positions in leveraged markets. Thanks to this, there was a kind of healing of the space, which resulted in consequences in the behavior of key indicators.
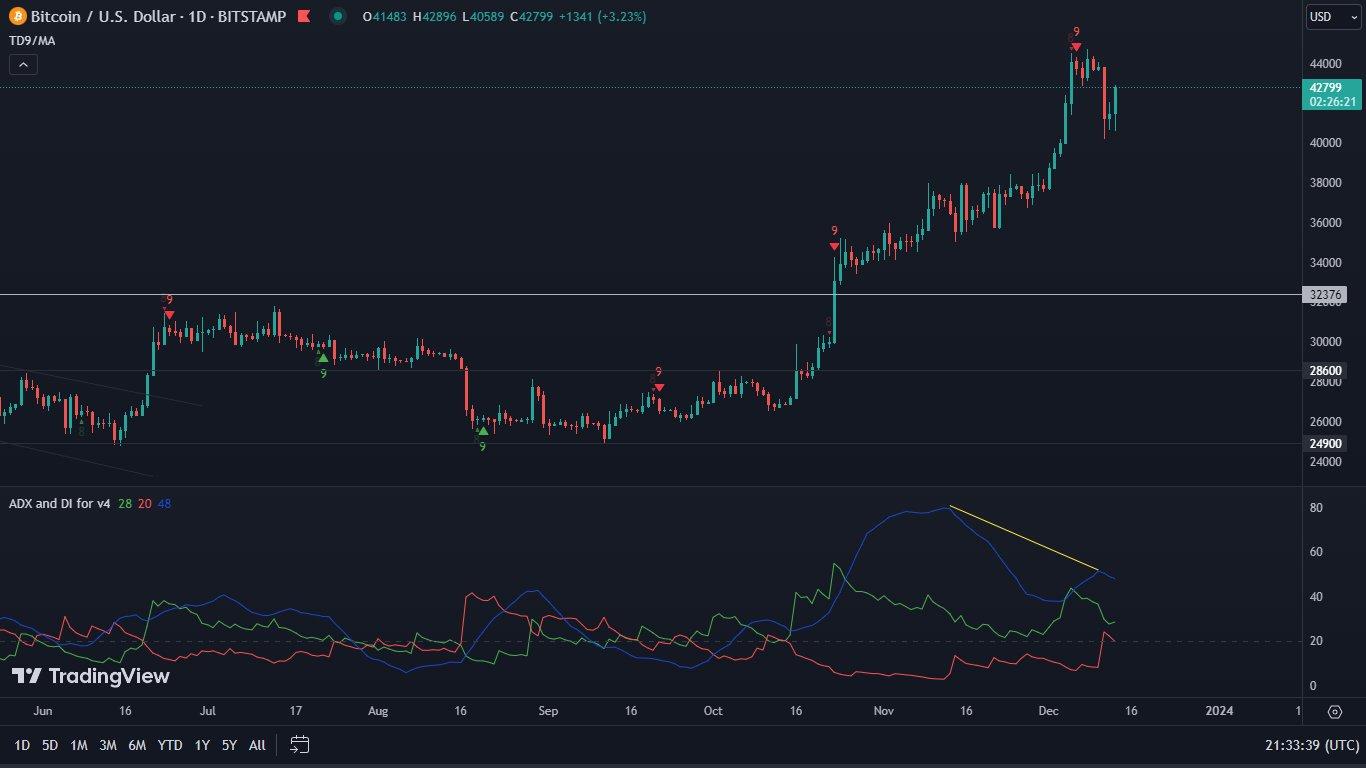
Thus, we can see that the divergence that was forming between the price of BTC and volume was almost completely negated. The overvaluation depicted by the TD Sequential indicator was also reset.
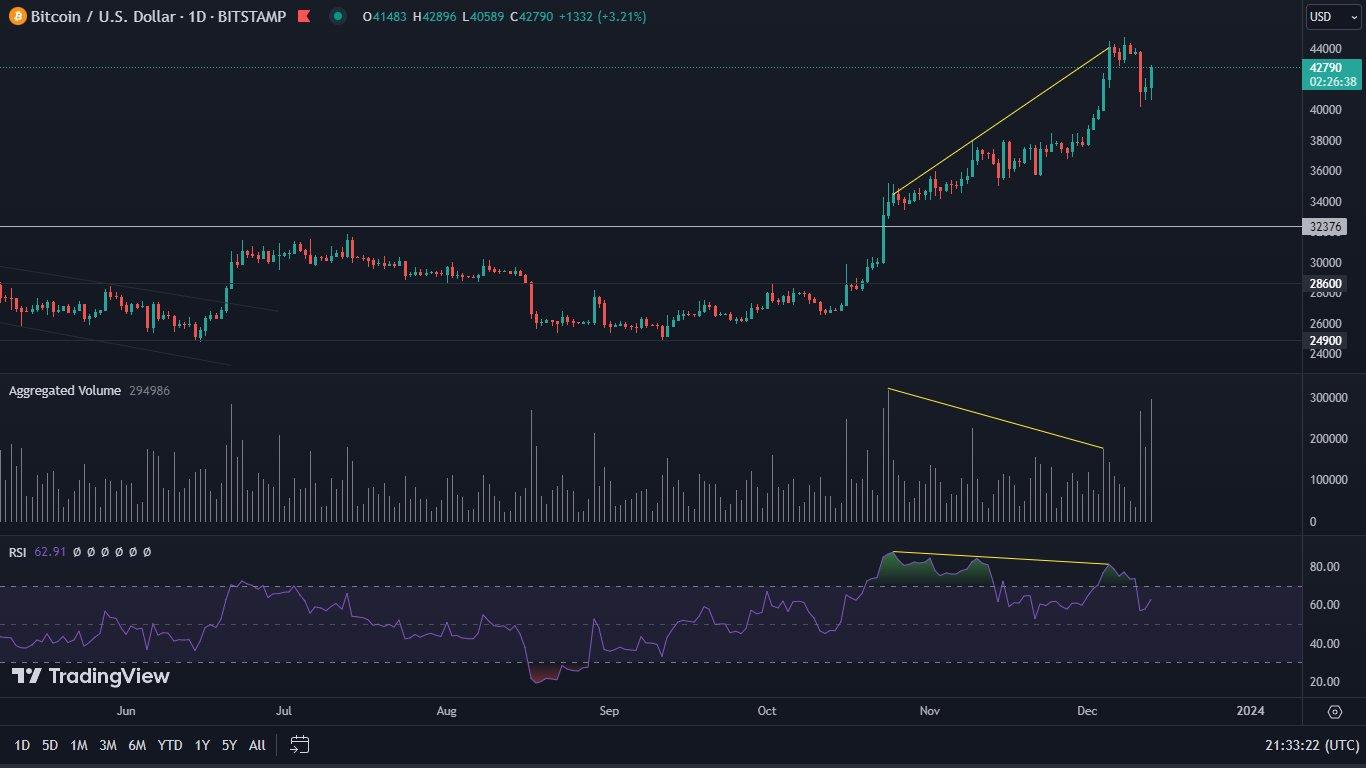
Nevertheless, the RSI divergence still remains in play. Similar behavior is shown by the ADX indicator. Both suggest that the ongoing trend is losing its strength. All this has the right to result in a stronger correction.
However, it is difficult to determine when it will occur. This is because formally, Bitcoin is still showing a clear desire to attack towards $48,000. Any descent of the price towards $40,000 has the right to result in further strong purchases.
Altcoins show appetite to rally
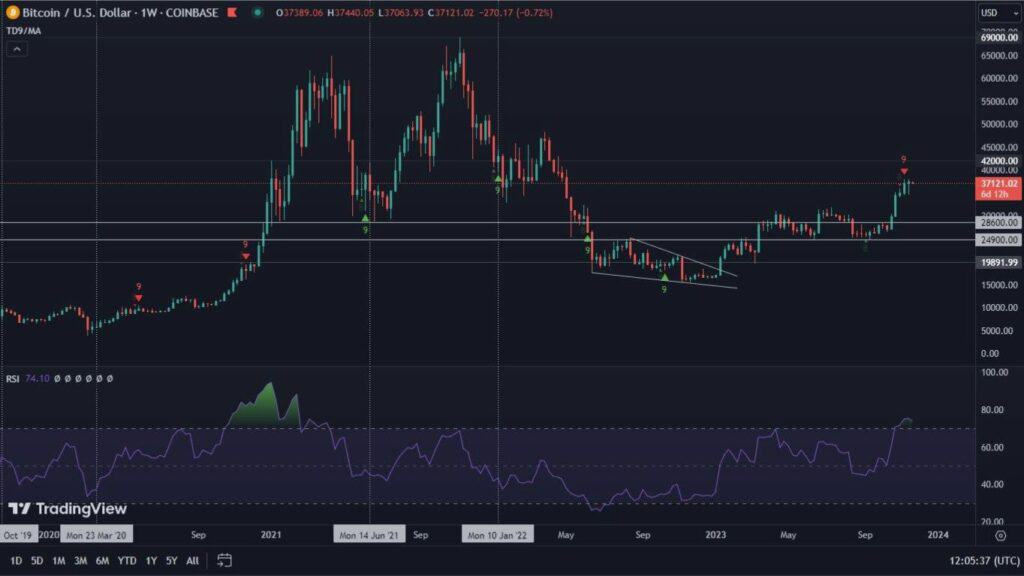
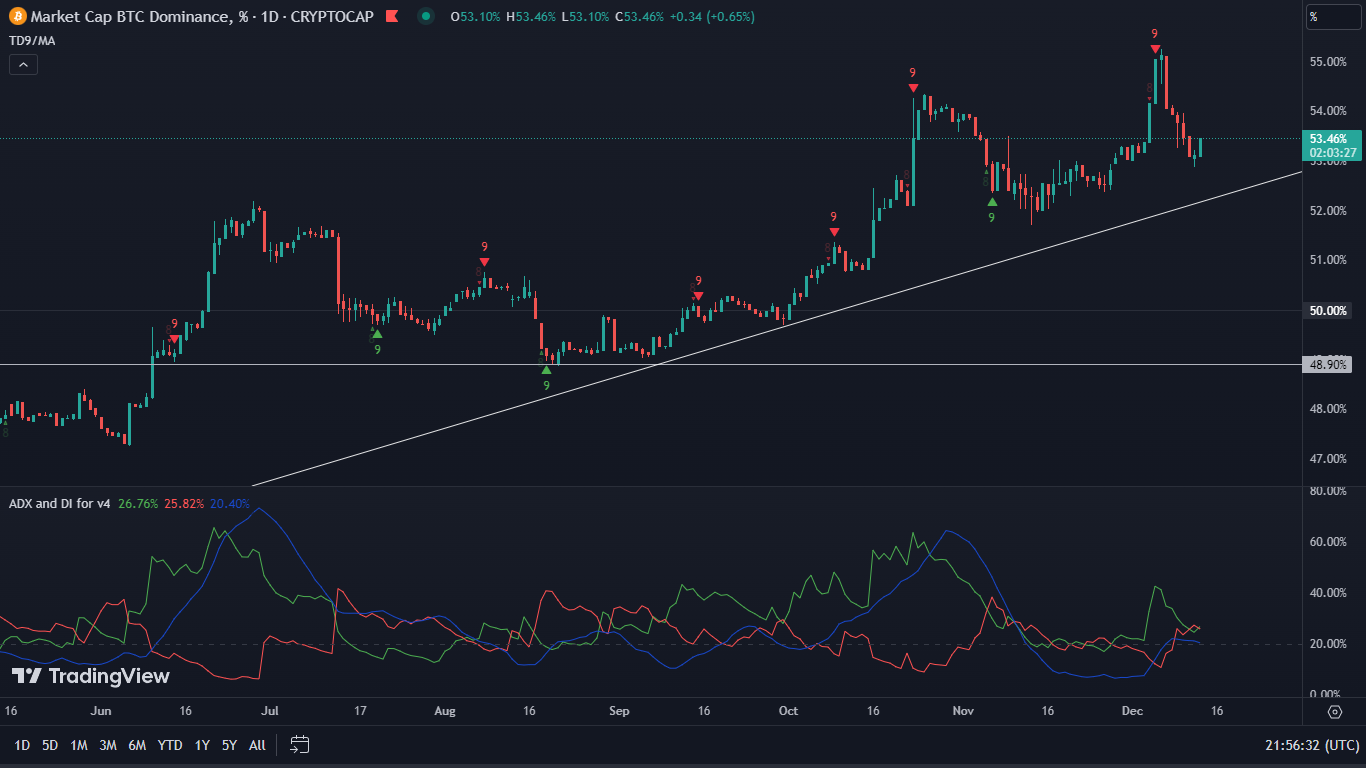
Although Bitcoin’s dominance remains steady above the 53% level, there are a number of indications suggesting that altcoins’ time is coming in a big way. In a past analysis, we highlighted an important trend line that BTC is inexorably approaching and from which it is also regularly bouncing. The leading cryptocurrency was pushed there at least by TD Sequential. There are also a number of divergences on the chart. Below we point out the one formed by the ADX. The strength of Bitcoin’s uptrend is therefore losing strength. A break of the line, in this case, could mean that altcoin investors will begin to take solid profits.
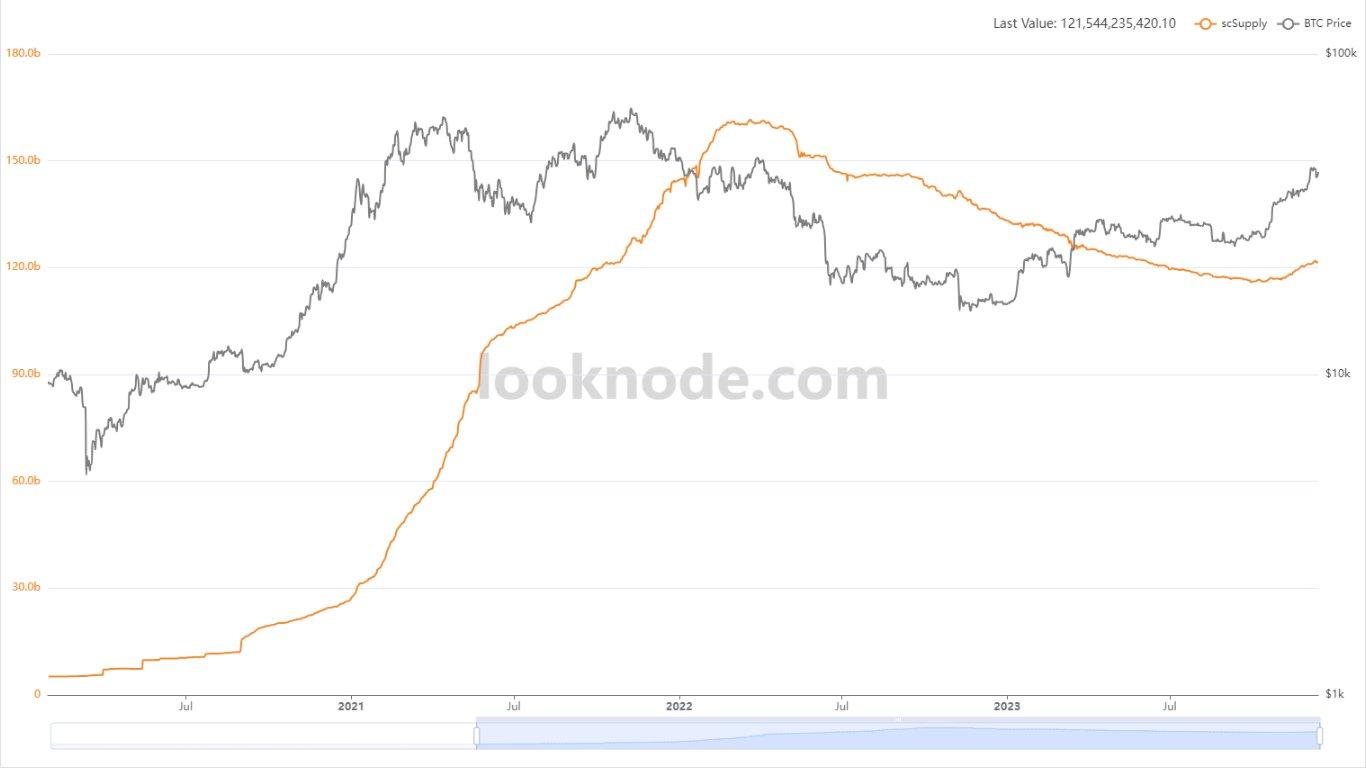
Capital is constantly flowing in
Here is one of the most bullish charts we can observe. The number of stablecoins in circulation is steadily increasing, which means that outside capital continues to flow into the crypto market. The graphic below is shared by Looknode.com. Based on it, we can speculate that the crypto space is entering a new upward trend.