While market sentiment is increasingly bearish and numerous analysts are expecting an imminent valuation of Bitcoin at $14,000 or even well below, there are sporadic but extremely bullish voices. Some of them are seeing the price of Bitcoin around $100,000 and still in 2023.
Bitcoin one step away from a big rally?
One of the popular analysts of traditional markets, who also very eagerly glances in the direction of Bitcoin, published an interesting graphic on his Twitter profile.
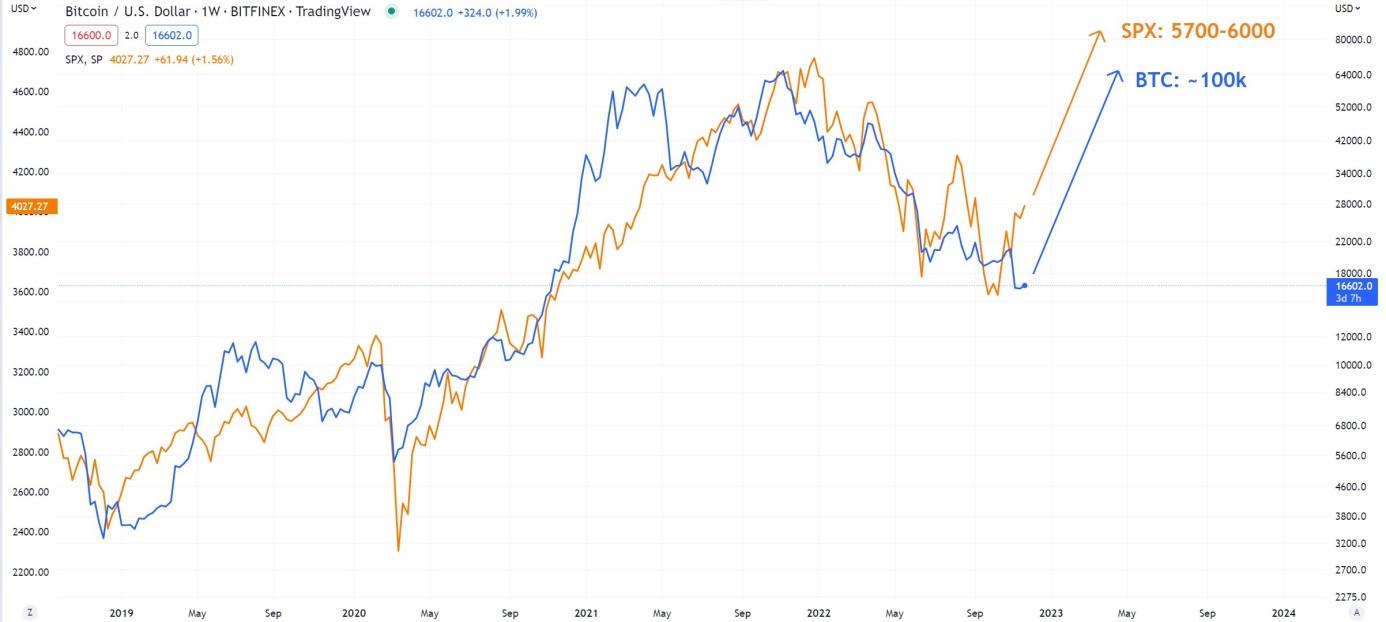
In it, Henrik Zeberg points out the unique correlation that exists between Bitcoin and traditional markets. According to him, the US S&P 500 index is close to reversing its downward trend. Along with it, the same should apply to Bitcoin. As he writes:
“Bitcoin is moving as a risky asset (not like gold!). When SPX explodes higher in the Blow-Off Top towards the 5700 – 6000 target area – Bitcoin should reach 90k – 110k.”
Looking at the chart posted by Zeberg, one can assume that this rally will already take place in the coming year.
Bullish structure of the BTC chart
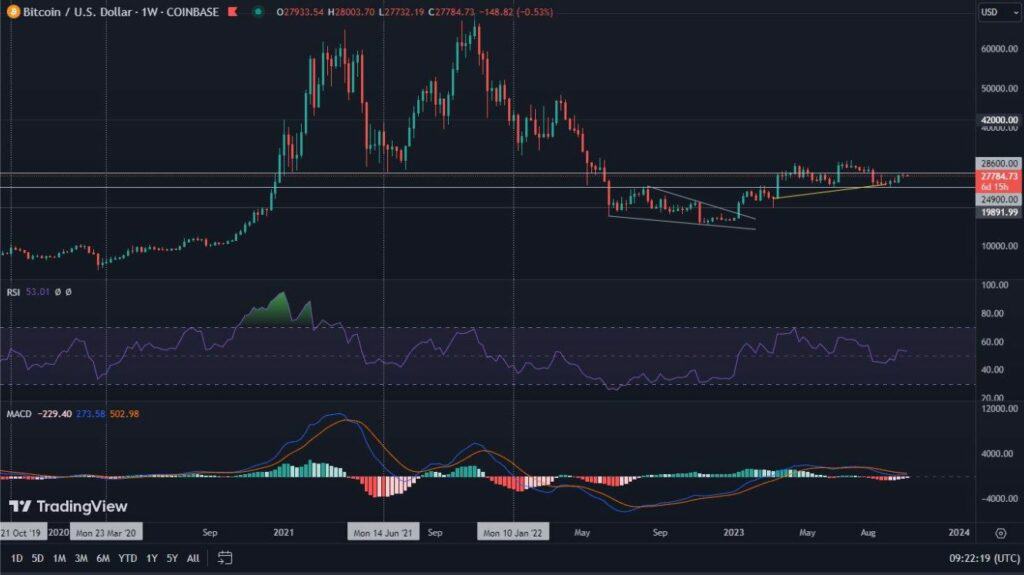
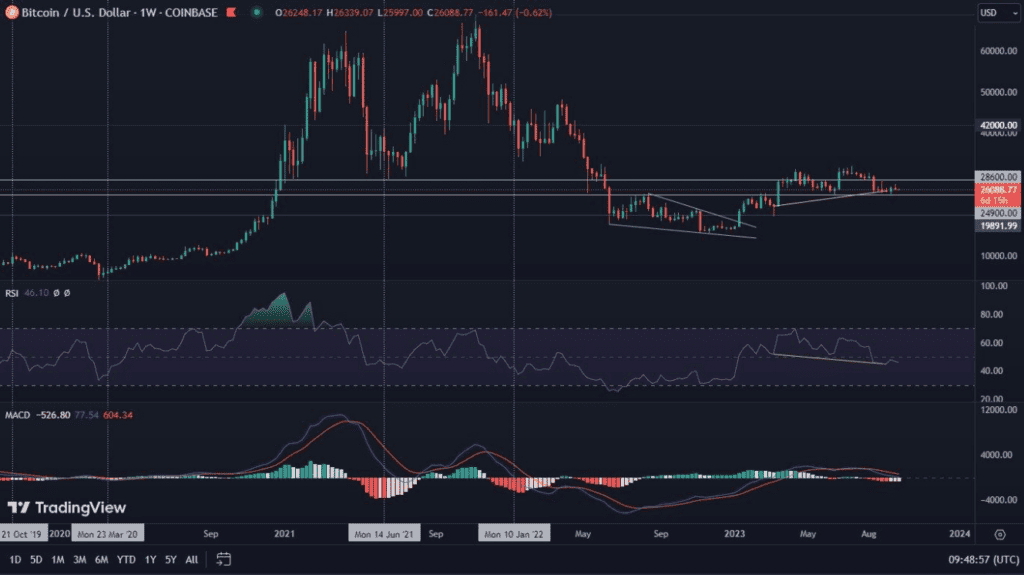
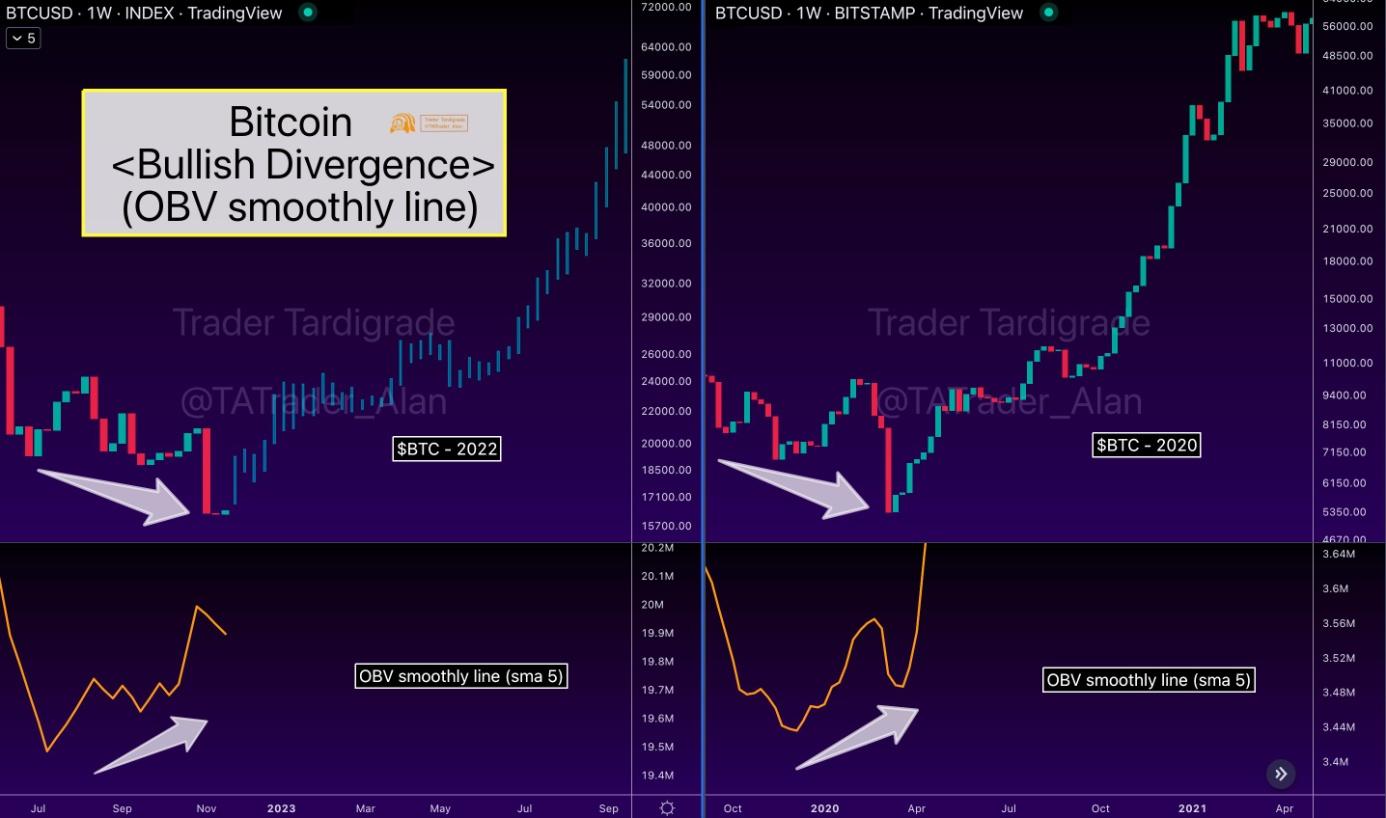
Another analyst who notes that Bitcoin’s chart is starting to look more favorable, and very bullish, is Trader Tardigrade. He points out, in turn, the very significant bullish OBV divergence, which extends over 20 weeks on the weekly chart. As he notes, this indicates weakening selling momentum and a possible reversal of the move.
OBV here is a cumulative measure of volume, both buying and selling. The divergence of the indicator from the price action, very often works as a signal for an imminent reversal of an ongoing trend.
Divergences are becoming ubiquitous
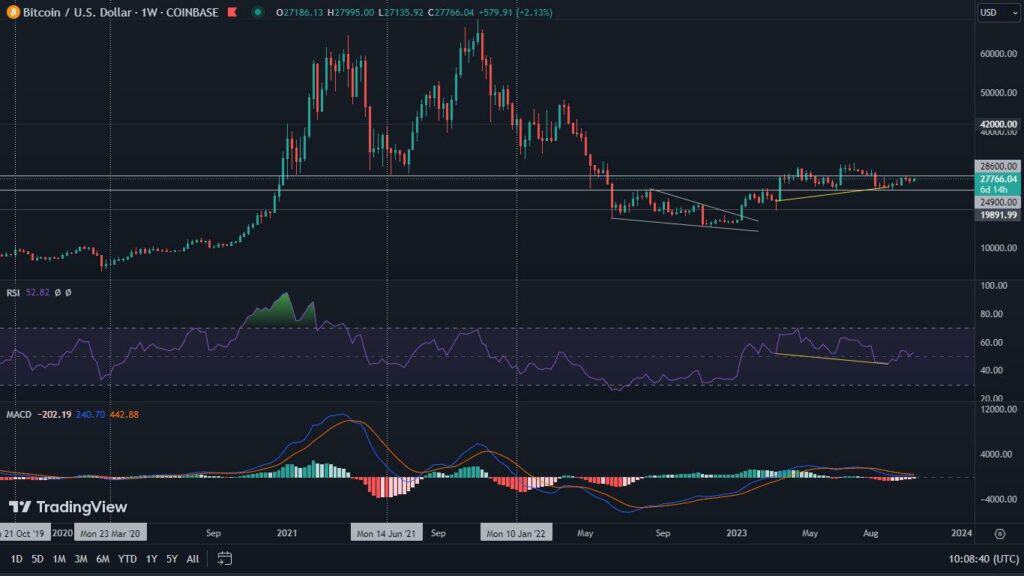
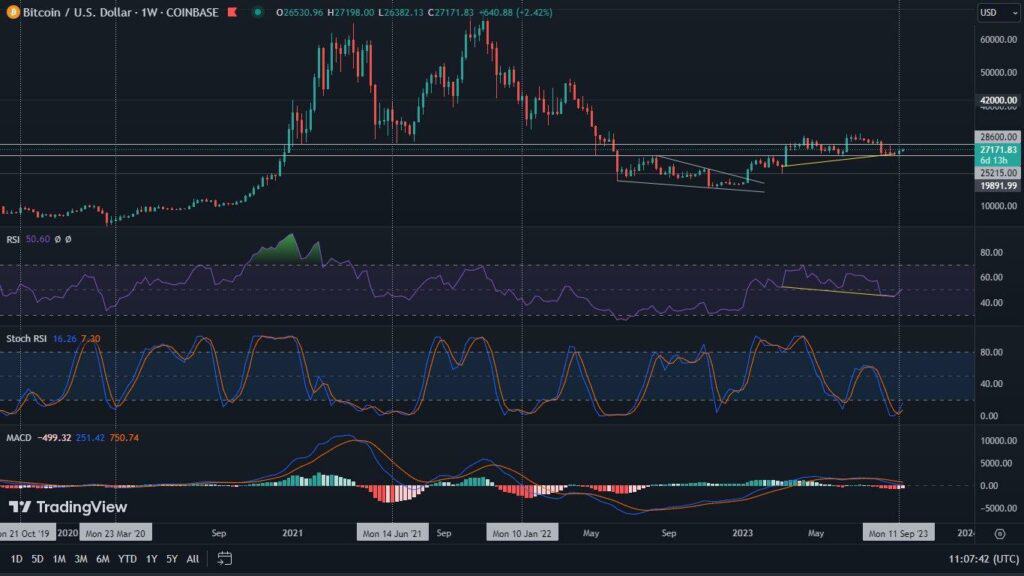
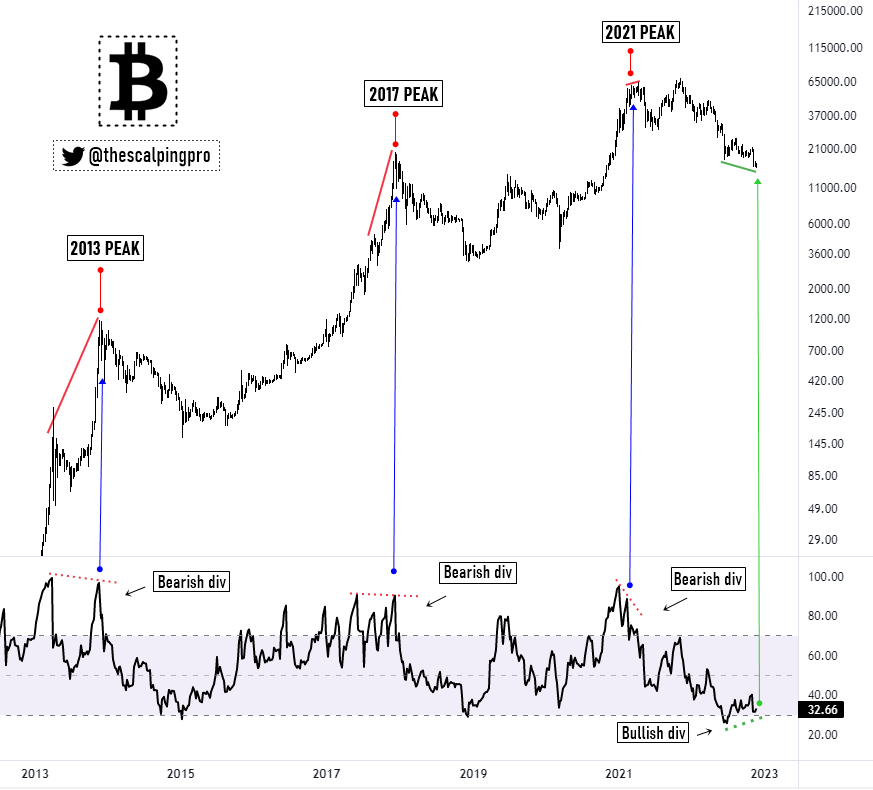
Another interesting divergence, on the other hand, is pointed out by the analyst known as Mags. He is referring to the RSI on the weekly interval, which, like the OBV cited earlier, has been forming a clear divergence for more than 20 weeks.
The uniqueness of this situation is underscored by his own words:
“Each BTC bull market peak created a bearish divergence on the RSI, followed by a bear market correction! This is the first time ever on a weekly chart that BTC prints a bullish divergence.”
We also reported on similar divergences in our analyses recently. You can find the most recent one here: “While the technical data is encouraging, there is more than enough fear in the Bitcoin market.”