Bitcoin is surprisingly up almost 60% in 20 days. It is also above a key level in the form of the 200-day moving average for the first time since May 21. We present an updated analysis of the price situation of the king of cryptocurrencies.
Return above the critical bull market support point
The 200-day moving average is a boundary observed by many traders. Historically, it has been a critical bull market support level for the Bitcoin price. This was the case during the road to the top in 2013 and was similarly the case in 2017. At that time, Bitcoin only briefly swung below the value indicated by it. During the current bull market, however, the behavior of the leading cryptocurrency is somewhat different, which has sparked a public debate as to whether the last less than 3 months have already been a bull market. At this very moment, the final battle is underway, to effectively deny this thesis.
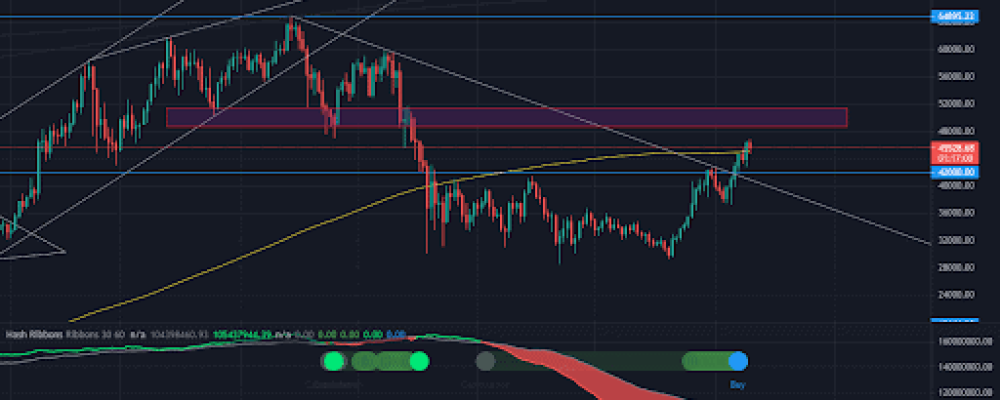
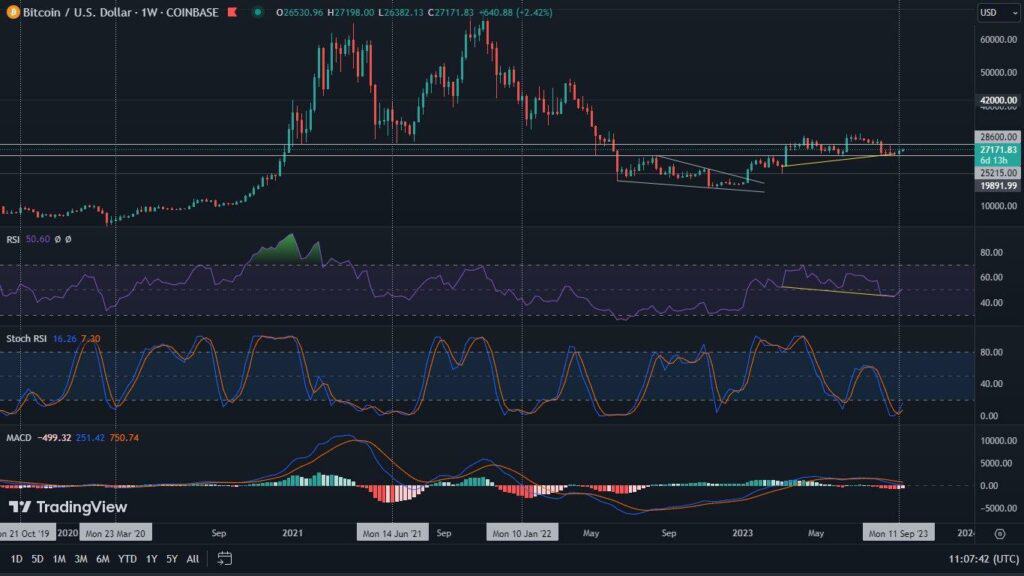
On August 9, the price of BTC closed above the aforementioned 200-day moving average, which is a sign that the bulls are definitely coming to the fore (yellow line). Successful defense of this level in the coming days should be perceived by the market as a return to a longer upward phase. On the chart, in addition to this indicator, we also observe higher highs and higher lows, which reflects the change of the current trend. Also, the breakout of $42,000, which was previously a key resistance, is a very bullish factor. What is even more interesting is that we can observe a long-awaited buy signal on the Hash Ribbons indicator (at the bottom of the chart). This long-term indicator in the history of BTC has already appeared a dozen times, always heralding a positive price rally. Even in a bull market, but then it was insignificant. The last time we saw it was on December 2, 2020, and after that we experienced increases in the value of BTC by less than 250%, thus reaching the April ATH. It is also worth noting that on the MACD indicator, on the weekly interval we will most likely soon see a golden cross, which is an equally strong long-term upward signal.
In the current situation we should look for potential next resistance levels. One of them is the range between $48,500 and $51,500. It is determined by the historical rebound values of the BTC price, during local corrections (marked with a rectangle). Another resistance where Bitcoin may spend some more time is the wide band between $55,000 and $61,500. The long-term price action that has played out right there in the past could take place again. Once these levels are broken out, bitcoin will be left to fight the last level which is the current ATH, located just below the $65,000 line.
Bearish Scenario
The potential downward scenario, although much less popular, should also be kept in mind. Several factors may influence its possible realization.
On the chart we observe divergences (marked in orange). They appear on the RSI and MACD indicators (in this case daily). The movement of indicators in the opposite direction to the price movement may suggest a local correction. In addition, the volume has been weakening in recent days. Considering that this happens while crossing such strong resistance as 200-day moving average, it may suggest a false breakout. In this case, we should again look for support near $42,000. Failure to successfully defend this region could send the value of BTC to the vicinity of $35,000 – $38,000. If a possible local correction would not be stopped here, then Bitcoin will face another test of $30,000.
To sum up…
The vast majority of indicators suggest a strong bull market return. However, there are also some that expect a correction. A healthy scenario would be a higher price breakout, and a subsequent test of the 200-day moving average as support. This could simultaneously lead to a reset of the bearish indicators. Then the start of a rally for a new ATH will become highly probable.


