The declines of Bitcoin and the entire cryptocurrency market are endless. A key support was broken, which caused a move that the history of BTC has not yet known.
A test of the previous ATH
In last week’s analysis, we highlighted the Hash Ribbons indicator, which in a given situation, may have been a factor suggesting an imminent final capitulation. Since then, bitcoin has fallen 32.5%, breaking the level of the 200-week moving average in the process. This line, marked in green on the chart, is a key support level for BTC. It is from this that the leading cryptocurrency constantly bounced back during the biggest drops, or instantly regained it after dynamic descents below.
Nevertheless, on the chart, something happened that has never happened before. Well, bitcoin is currently testing the level of the ATH it set in the previous cycle. History so far has not known such an instance, which makes it undeniable that the current cycle becomes absolutely different from any preceding cycle.
Looking through the Bollinger Bands and the level which was reached on them we can see that the market is in panic. This may result in a difficult to contain sell-off, which may be strengthened by the interest rate hike in the United States. However, the oversold that we are already seeing is also a chance to get back above the 200-week moving average, the maintenance of which should calm the market.
Charts confirm capitulation period
The bottom of Bitcoin’s valuation, in the event of a panic sell-off and a possible break of the 2017 ATH, is extremely difficult to determine. Nevertheless, some indicators are emerging that suggest the end of the declines is near. One of them is the MVRV Z-Score, which has already entered the area suggesting capitulation.
A similar situation can be observed on the Net Unrealized Profit/Loss (NUPL) chart.
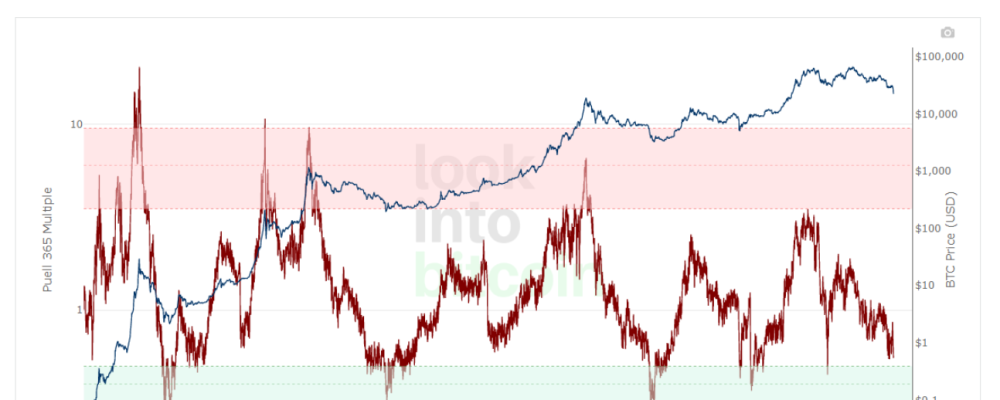
The Puell Multiple and RHODL Ratio look slightly different, yet equally interesting. In both cases we can see that the level of final capitulation has not yet been reached, yet it seems to be very close.
Bitcoin’s dominance is declining along with it
It may come as a surprise that despite BTC’s declines, the dominance of the leading cryptocurrency is not growing at all. In the previous material, we suggested that there could be a situation where, near the 50% level, altcoins take the lead. However, this rarely happens when the whole market is falling. This is most likely due to the fact that bitcoin has touched the most important support levels in its history. In such a moment, the chances for a rebound increase significantly. Altcoins, which usually in such moments gained the most, therefore in the eyes of many investors become a real investment opportunity. Meanwhile, as can be seen on the chart, the value of dominance has reached the limit of Bollinger Bands. At the same time, bullish divergence of RSI and oversold on Stochastic RSI are visible. This may result in a renewed strengthening of BTC’s dominance.
Macroeconomics determines crypto market behavior
The strengthening dollar index, and with it the specter of continued interest rate hikes both in the United States and globally are factors that strongly project the current health of the cryptocurrency market. Until we see stabilization in this space, it will be difficult to talk about further strong cryptocurrency rallies. Nevertheless, smaller attacks on key levels still remain possible. First, however, BTC must find its final bottom.


