There is a real rollercoaster going on in the cryptocurrency market. Although Bitcoin is in consolidation, it is moving quite dynamically both up and down. To find the answer to the question of what’s next for its price, this time we will look at it from three different perspectives.
Bitcoin on a monthly chart
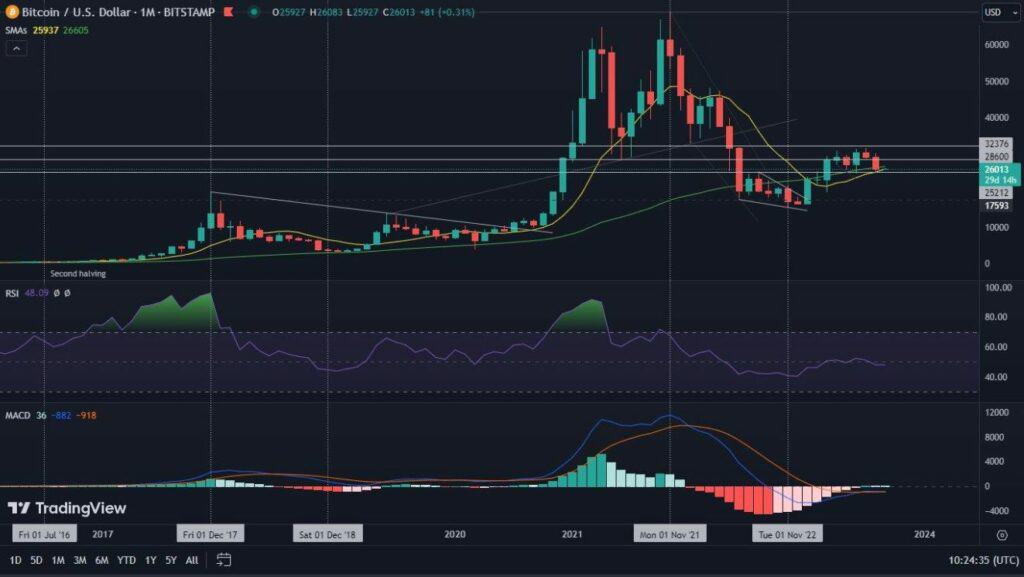
We will start by presenting the price action on a monthly chart. This is one of the best perspectives for long-term investors who want to offset the short-term noise.
What immediately catches the eye on it is the still present uptrend. It is indicated by higher highs and higher lows. In addition, the RSI shows the presence of a bullish divergence (yellow lines). Of course, on such a broad time interval, we do not know when it could come to fruition. Moreover, given that the divergence refers to the moments of closing of the price action, as well as the end of the indicator’s movement, a significant price decline and a dynamic recovery to higher levels is still not out of the question. If such a scenario plays out within one month, the indicator will remain in place.
Bitcoin on the weekly chart
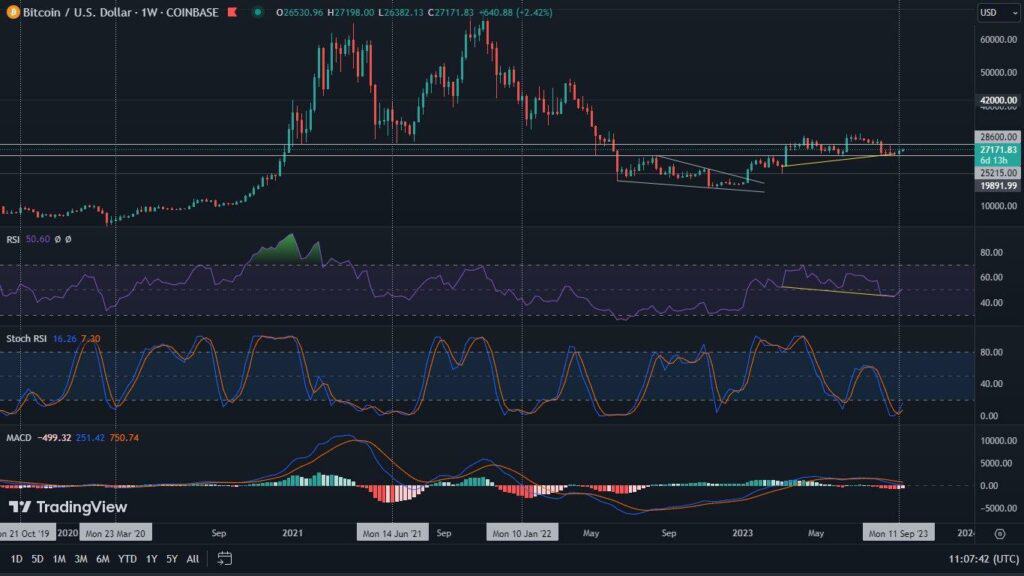
Another strong indicator is the weekly chart. Recently, many things happened. Let’s pay attention to the way the past week closed. We see a green candle, with a very long wick extended upwards. Many analysts read this as the first signal of a change in trend, from downtrend to uptrend. However, the candle wick shows successive rejections of important levels. The blue line indicates the 20-week exponential moving average from which the price bounced. The green line is the 50-day moving average, which once again failed as support. In addition, you can still notice the gray space marking the price range between $40,000 and $42,000. This is an important level that has also once again failed to support the price action and is perhaps starting to lose its significance. However, a positive sign is that Bitcoin is still holding above the long-term uptrend line, marked in yellow. Moreover, the MACD is pointing to weakening downward momentum and a potential upward relapse. However, as long as the price fails to form a higher top, the downtrend remains.
Bitcoin on a daily chart
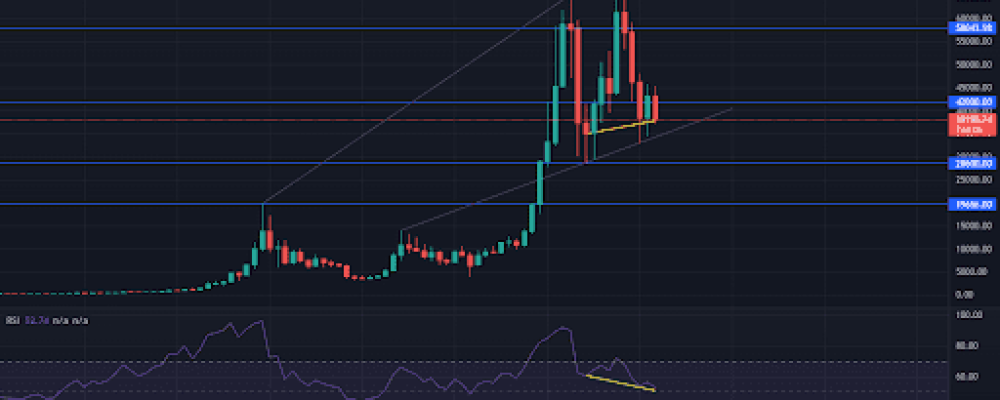
On the daily chart, the most interesting hypotheses are formed in this analysis. With the white continuous lines we have drawn a formation that is forming, which sends two contradictory signals and whose interpretation takes time. From a bullish point of view, we may be witnessing the formation of a triple bottom. The support of the formation is of course the yellow line of the upward trend. The third rebound of the price from it and the completion of the formation with the upward movement may lead the value of BTC to levels above $55,000. However, the same structure has signs of a bearish “M” formation.
This means that if the yellow support line fails to hold the price action, Bitcoin has the right to fall even in the vicinity of $23,000.
External factors with a potentially strong impact on the price
As you can see, the lower the time period we look at, the potential behavior of the Bitcoin price will instill more uncertainty. Therefore, it is worth being vigilant and keeping an eye on external factors, such as the conflict in Ukraine. The sanctions imposed on Russia are having a negative impact on more than just the country. It weakens many economies. This can be seen on the example of the S&P500 index, which shows signs of the beginning of a downward trend. Bitcoin can be highly correlated with it. Potential downward movements of traditional markets, therefore, may worsen the situation of cryptocurrencies. On the other hand, the current time is an opportunity for Bitcoin to prove that it is a true store of value.


