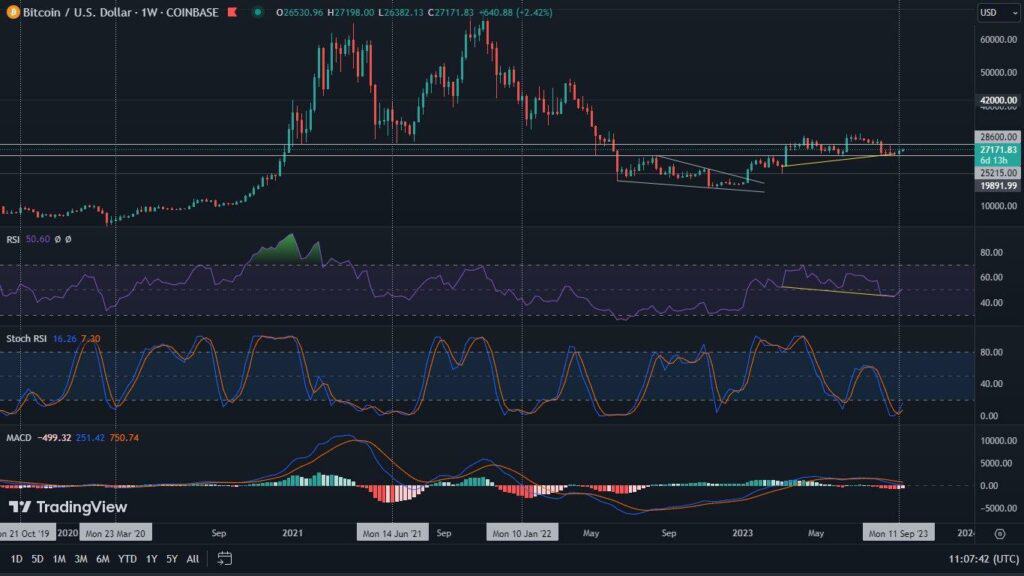
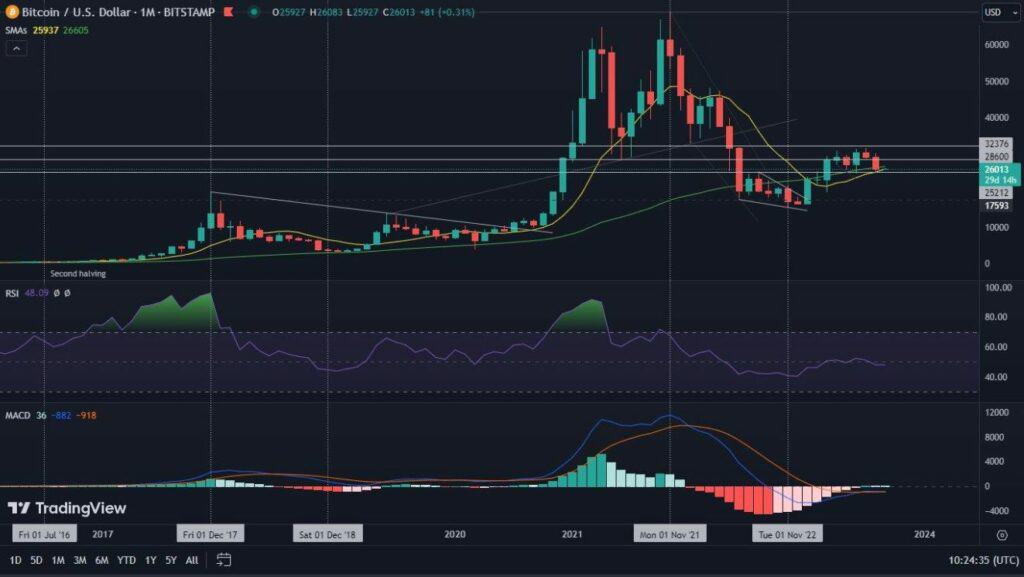
While we’re still seeing a period of consolidation on the Bitcoin price chart, it’s worth taking a look at the on-chain data. It turns out that these metrics have a lot of very interesting information to tell us.
BTC reserves currently held on exchanges
One of the most important metrics, which is the balance of bitcoin on exchanges, shows us a steadily decreasing number of coins found there. Currently, the number stands at 2,370,313 and this is another 3-year low. This is definitely cause for optimism. The fewer coins there are on the exchanges, the less likely there are to be sudden sell-offs. However, it is still a sizable amount that could turn the market around in the face of various circumstances. Nonetheless, the trend remains downwards, which should be reason for optimism and should trigger upward moves in the long term.
Open Interest is Growing
Another interesting metric is the number of open futures contracts. It shows that the appetite for risk is growing among investors. There are various reasons for this. On the one hand price stagnation creates impatience, which translates into greater interest in leveraged positions in order to maximize profits in a short period of time. This is also triggered by local increases and the expectation of a solid price breakout. However, it is worth noting that such price action takes place inside the formations we describe in our technical analyses. This is not a recommended form of trading according to the art of trading. Therefore, we can expect potential movements focused on liquidation of long and short positions. In short – expect volatility.
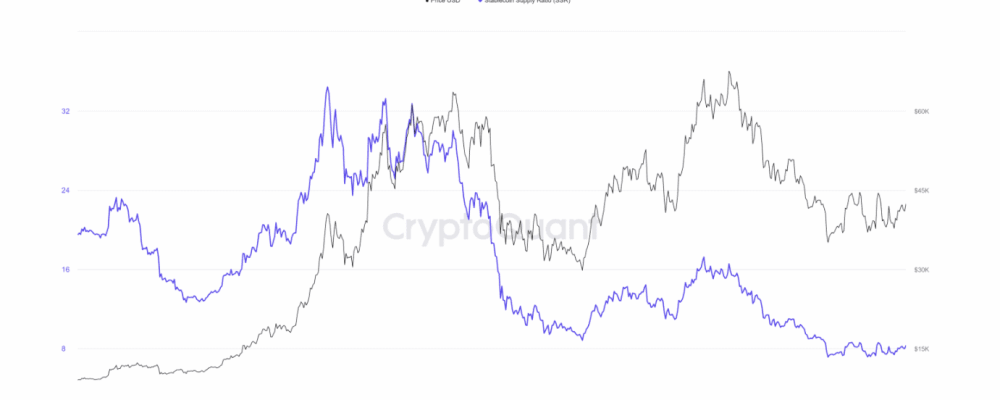
Stablecoin Supply Ratio
The ratio of the market capitalization of coins to the aggregated market capitalization of all stablecoins, or SSR. The low values observed here, indicate a high supply of stablecoins. This is capital waiting to return to the market, which may have the effect of increasing buying pressure once it fully determines the direction of its movement. In doing so, we are seeing a rounding bottom on the chart, this is the first signal suggesting a potential trend reversal.
SOPR struggles to regain level 1
According to the data collected on the Spent Output Profit Ratio chart, we can observe that bitcoin is struggling to regain the key level which is 1. When we are above 1, this is the time when most of the market participants are trading in the profit zone. On the other hand, being below 1 – most traders are accepting losses when selling their BTC. It looks like bitcoin is at one of its key decision points. We have overlaid the 14-day moving average on the chart so as to negate the short-term noise.
MVRV Z-Score leaves room for downward movement
One interesting indicator that gives historically a lot of key information is the MVRV Z-Score. It is known for marking periods when bitcoin has hit its valuation peak, as well as the bottom of a bear market or strong local correction. While there are questions in the public space as to whether a final surrender event is still possible, looking at the MVRV Z-Score, we can clearly say yes. It is worthwhile to have stablecoin reserves prepared for such an occasion. Perhaps those waiting on the exchanges are just waiting for a similar event.


