Bitcoin is definitely ruling the market. There is absolutely no doubt that we are currently witnessing the season for the largest crypto asset. To reinforce its position, the MACD indicator of the weekly interval, makes a significant turn.
Bitcoin on the monthly chart
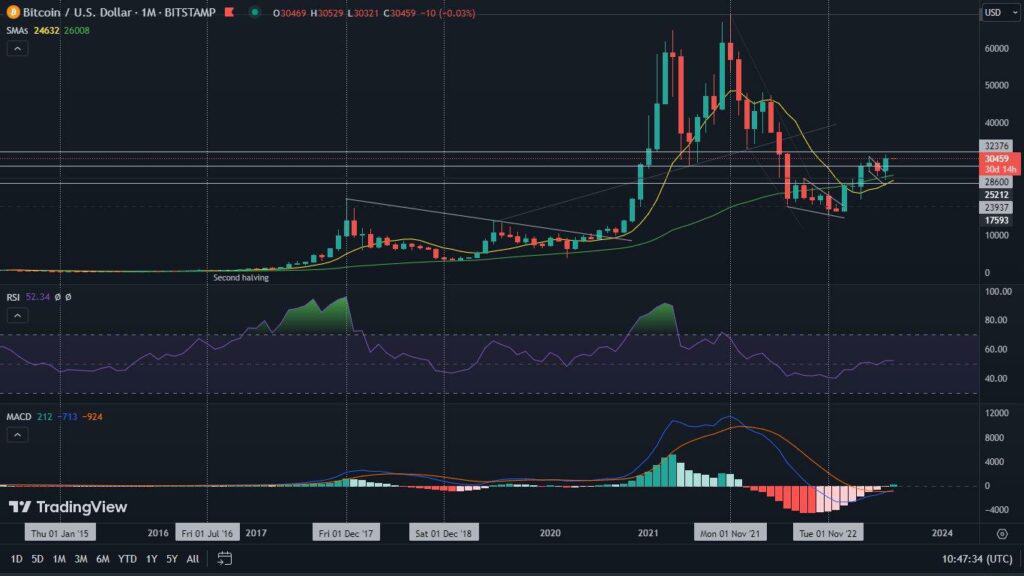
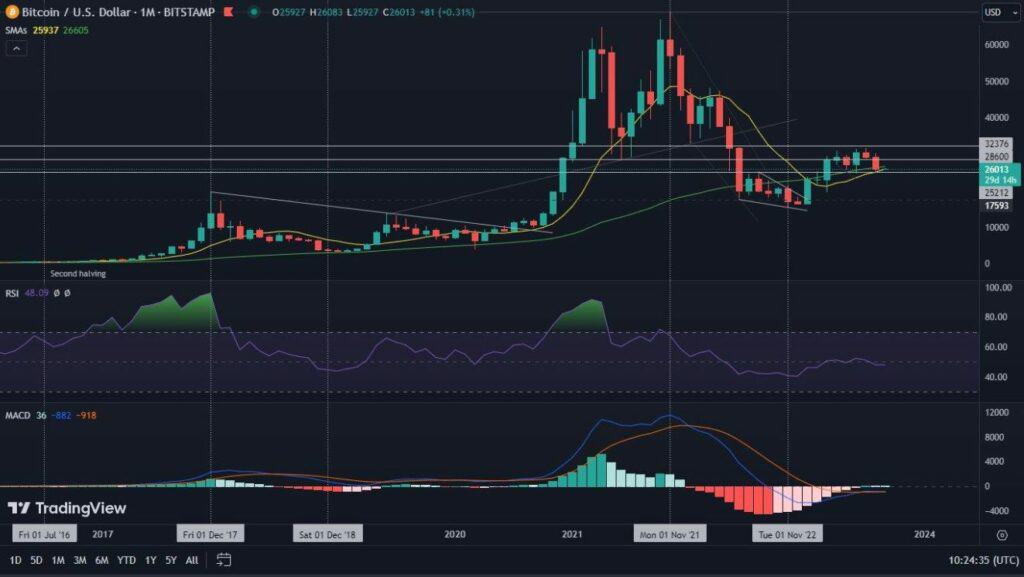
Before we move on to events, on the time intervals we classically present, we will look at the situation on the monthly chart.
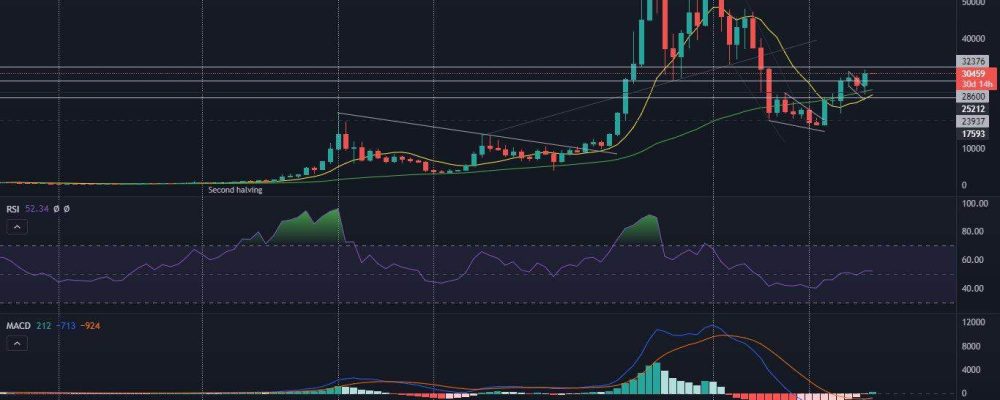
As good as it is now, the monthly chart for BTC has not presented itself for a very long time. We see a clear increase in the value of the cryptocurrency by 11.9%. RSI thus managed to rise above the level of 52. By the way, we are witnessing the formation of a potential bullish MACD cross. To talk about its completion, we should wait until next month for confirmation. Importantly, for the fifth consecutive time the BTC price closed above the 10-month moving average. On the other hand, for the fourth consecutive time, above the 20-month. For Bitcoin, this is a very important sign, indicating not only positive momentum, but also suggesting that we may be witnessing a preliminary phase to much larger upward movements.
In addition, we see two important confirmations on the chart. The first is support at the $25,000 level. The second, on the other hand, is the higher low, confirmed by the strong breakout of the candle above the previous peaks. This fact is a definitive confirmation of the sustainability of the current trend.

Bitcoin on the weekly chart
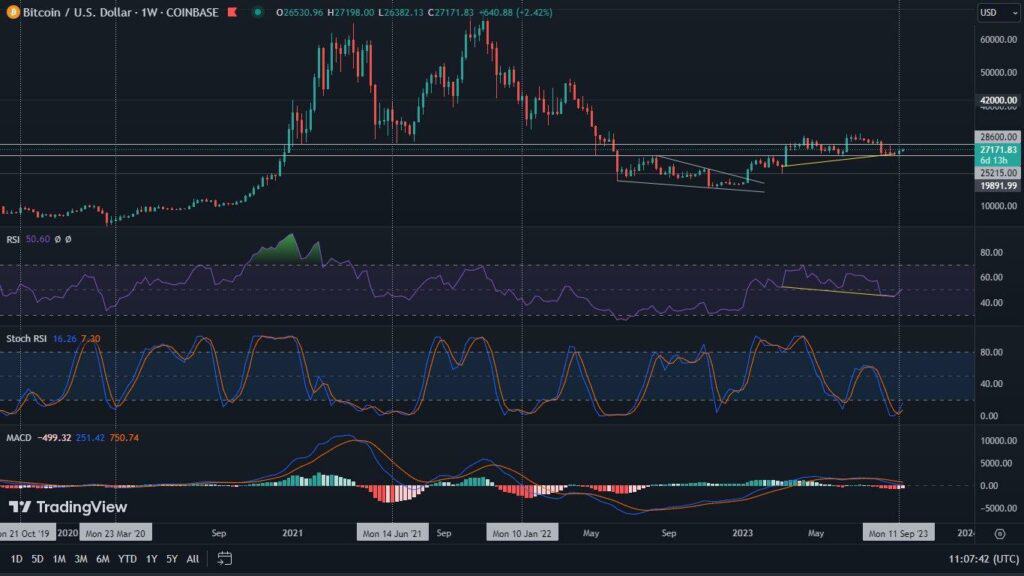
Despite the extraordinary recovery on the monthly chart, there seems to be a slight cooling on the weekly chart. However, it turns out to be apparent, as there are reactions from indicators that may herald important movements to come.
Bitcoin rose 0.5% in the past week. RSI rose above the 62 level. However, what is most important is that MACD made a bullish cross. This is significant because only a few weeks ago we reported on a confirmed bearish cross. So it turns out that it was negated in no time.
The bullish MACD cross on the weekly interval has historically heralded an upward wave. Thus, if the local momentum is maintained, it becomes increasingly likely that resistance between $31,000 and $32,000 will be overcome.
Nevertheless, before attacking the resistance, a gentle retreat of the price is also not excluded. This scenario is indicated by the local RSI divergence.
Bitcoin on the daily chart
Bearish RSI divergence is transformed into a bullish one. This is currently the situation on the daily chart of BTC. We indicated the first of the anomalies with the yellow dashed line. The second, on the other hand, with a solid line. The temporary cooling of the increases is therefore justified, but as we can see, it could have an end at any time. The ADX indicator, visible at the bottom of the screen, is also cooling down. The whole is complemented by the MACD, which is also currently struggling with a clear bearish momentum. The levels to watch in the short term seem very clear. Support for Bitcoin should be provided by the $30,000 value. This is where the aforementioned divergence can be defended or lost. Otherwise, a dive even to the vicinity of $28,600 becomes possible. On the other hand, looking for a chance for growth, it is worth watching the level of $32,400, the achievement of which will mean breaking through one of the most significant resistances in the history of BTC.


