As we know, Bitcoin is the strongest crypto asset in the world. Nevertheless, the success of the bull market is very often determined by the condition of meme coins. So let’s take a look at their situation. We take Dogecoin, Shiba Inu and Pepe under the magnifying glass. Let’s check how they look on the charts.
Dogecoin (DOGE) in uncertain waters
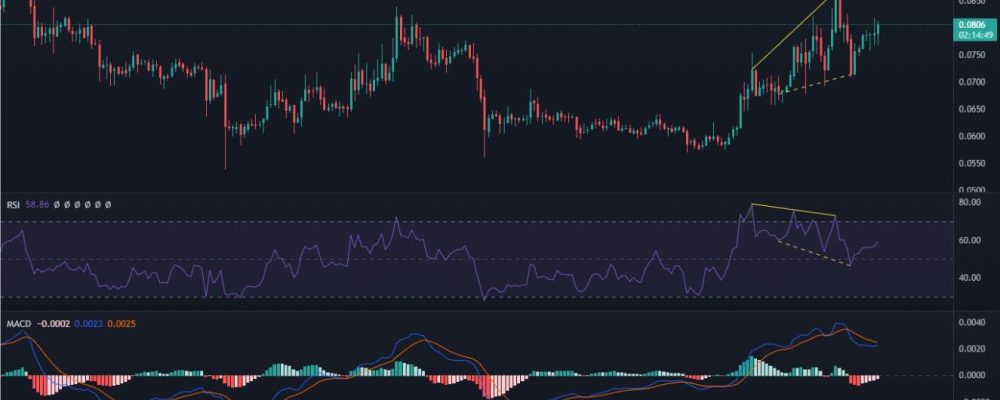
Dogecoin is currently at local horizontal resistance, defined by the $0.08 zone. We can also see that recently the coin was able to temporarily break through this resistance. However, this was short-lived in nature. The false breakout, supported by a bearish RSI divergence, triggered declines. As a result, on the chart we can find the first bullish RSI divergence (yellow dashed line) and the reaction to it. We do not believe that this is a clear signal of the end of the correction, nevertheless the indicator is making a clear reset. This may result in upcoming increases, which, however, we will observe in a slightly longer term. MACD remains favorable, but lacks stronger momentum.
Shiba Inu (SHIB) in perpetual consolidation
Great expectations and relatively few effects – this is how the Shiba Inu chart can be defined. However, let’s remember that extended periods of consolidation have historically heralded solid increases. Such may also await SHIB. However, it is difficult to determine the time in which they may take place. At present, the Shiba Inu is showing a delicate appetite for growth, which is highlighted by the bullish RSi divergence. However, it is very weak and, as a result, easy to negate. On the other hand, a positive aspect of the chart is the upcoming golden cross between the 50-day and 200-day SMAs. With the price above both moving averages, there is a likelihood of a medium-term upward impulse in the coming period. The current price of SHIB is $0.0000083. The key resistance for the coin may again prove to be $0.000012.
Pepe (PEPE) ready for more
The youngest of the analyzed coins, seems to be in a complete reset phase. The two indicators shown below tell us this. The first is, of course, the RSI. A clear bullish divergence, with the indicator’s rather deep descent, to relatively low values, makes us optimistic about a potential continuation of the upward movement. Another noteworthy indicator, on the other hand, is the ADX, which is also showing signs of a deep reset. A potential Head-and-Shoulders formation, on the other hand, may serve as a warning. For the time being, however, it has not been broken out, as a result of which PEPE continues to defend support, located in the area of $0.000001.
To sum up, mem coins show a relative willingness to rise. On the other hand, from a technical point of view, PEPE looks the most favorable.


