Despite considerable volatility, Bitcoin maintains high price levels. The shape of the chart may even indicate an upward consolidation. Meanwhile, indicators are not so optimistic and suggest to buckle down.
Bitcoin on the weekly chart
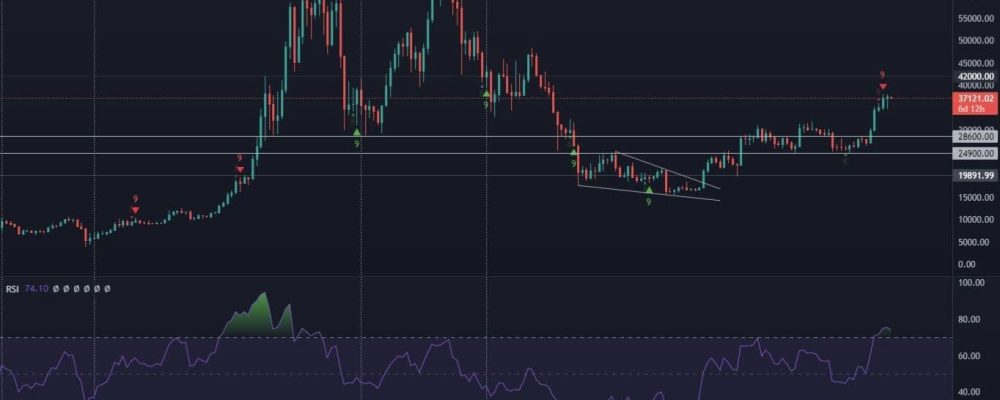
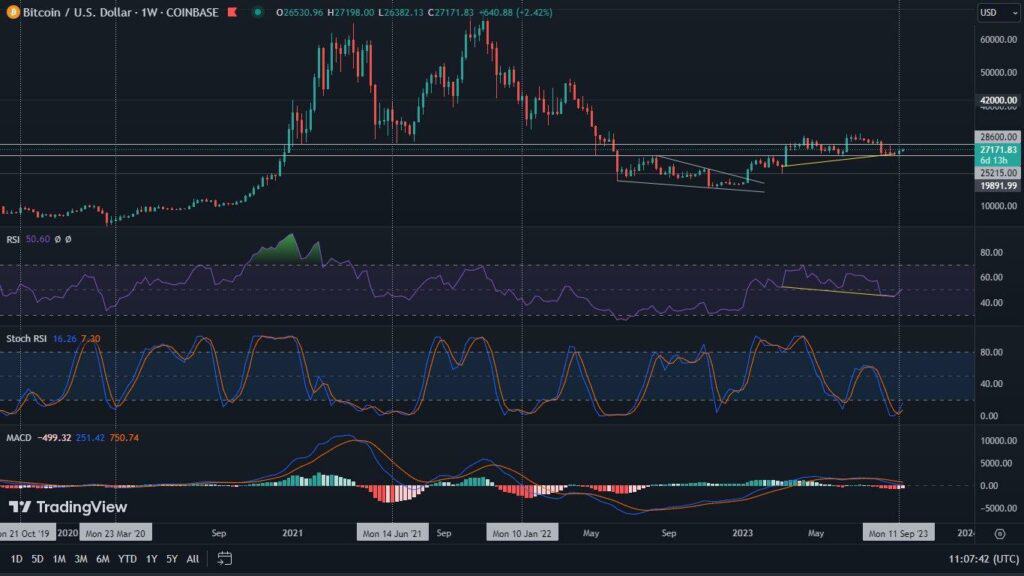
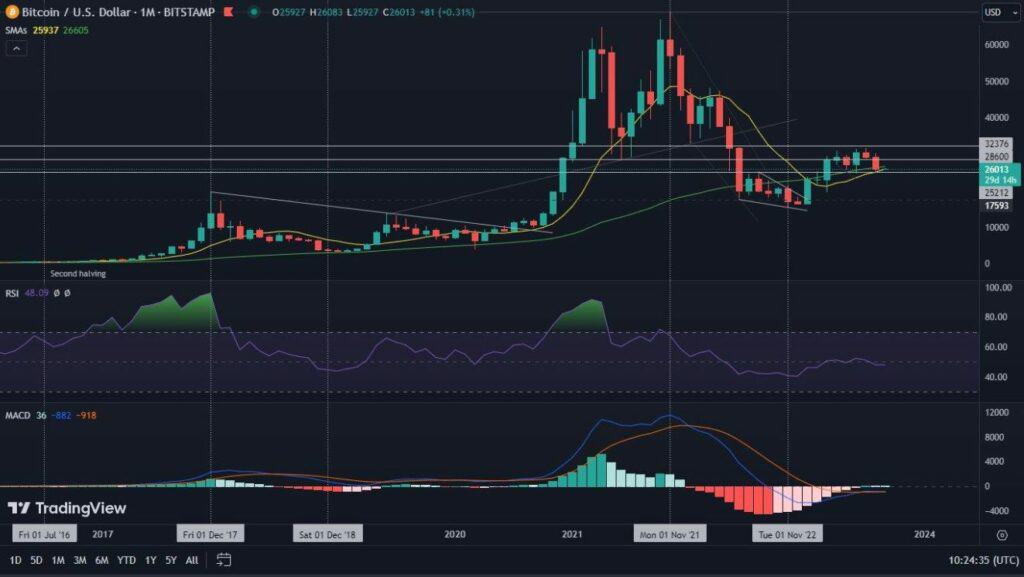
We traditionally begin our analysis by presenting Bitcoin’s situation on a weekly chart. Thus, we see that the price of Bitcoin in relation to the US dollar has increased by 0.8%. This is very little. However, this movement caused the RSI value to rise to the level of 75. The increases also resulted in the appearance of the tenth consecutive candle on the TD Sequential indicator.
This event should be regarded as a warning signal. For its validity, it is worth looking for confirmations. One of them is the Stochastic RSI, which, as in the past week, is now heading towards a bearish cross.
Looking for support in case of possible declines, it is once again worth directing our gaze towards the $32,300 level. In our opinion, this is a critical area where we anticipate strong defensive action.
The positive aspect of the weekly chart, on the other hand, is the shape of the last candle. This one maintains a bullish structure. The result is that the signals become ambiguous. Therefore, it is worth going down to the lower time intervals and just based on them look for the right clues.
Bitcoin on the daily chart
Despite very high volatility, Bitcoin is holding very strongly to this year’s record price levels. Any decline, even seemingly deep, results in an instant repurchase. Nevertheless, there are a number of warning signals that herald that buying power will drop significantly. The first and most important of these is volume. Although the price is rising, volume appears to be weakening. The RSI also looks weakened. A bearish divergence could push the BTC price to slightly lower price areas.
Importantly, we can also see a bullish RSI divergence on the attached chart, but in our opinion it is too early to be considered reliable.
The ADX indicator is also worth noting. It suggests very clearly that the strength of the previous trend has lost its momentum. Thus, the ADX is resetting, while the BTC price seems to ignore this. Such data points to a potential longer consolidation, while opening the door to possible declines.
As with the weekly chart, the $32,300 level is worth watching. It may prove to be a solid support point. Possible denial of this move, on the other hand, could result in a flash attack on price levels located just above the $40,000 area. With such a scenario, it will be necessary to pay attention to the volume. If this one does not increase significantly, the spike could turn out to be a false breakout.
Despite significant increases, altcoin’s time has not yet come
Many altcoins are recording very strong increases. However, looking at Bitcoin’s dominance chart, we can observe that the long-awaited altcoin season has still not arrived. The current situation has the right to fuel appetites, while the stock market data seems to tone them down.
Thus, the dominance of BTC still remains high above the important uptrend line. In addition, a few days ago we observed the ninth TD Sequential down candle, which has the right to suggest further gains on the BTC side. The whole is complemented by a bullish RSI divergence, which could give even more strength to a possible rebound.


